diagram.mmd — flowchart
Stream Processing Pipeline flowchart diagram

A stream processing pipeline is an architecture that continuously ingests, transforms, enriches, and routes high-throughput event data in real time, enabling decisions and outputs with latency measured in milliseconds rather than hours.

Traditional batch processing collects data, waits for a window to close, then runs a bulk computation. Stream processing eliminates the wait: each event is processed as it arrives, enabling use cases like real-time fraud detection, live leaderboards, dynamic pricing, and operational dashboards.

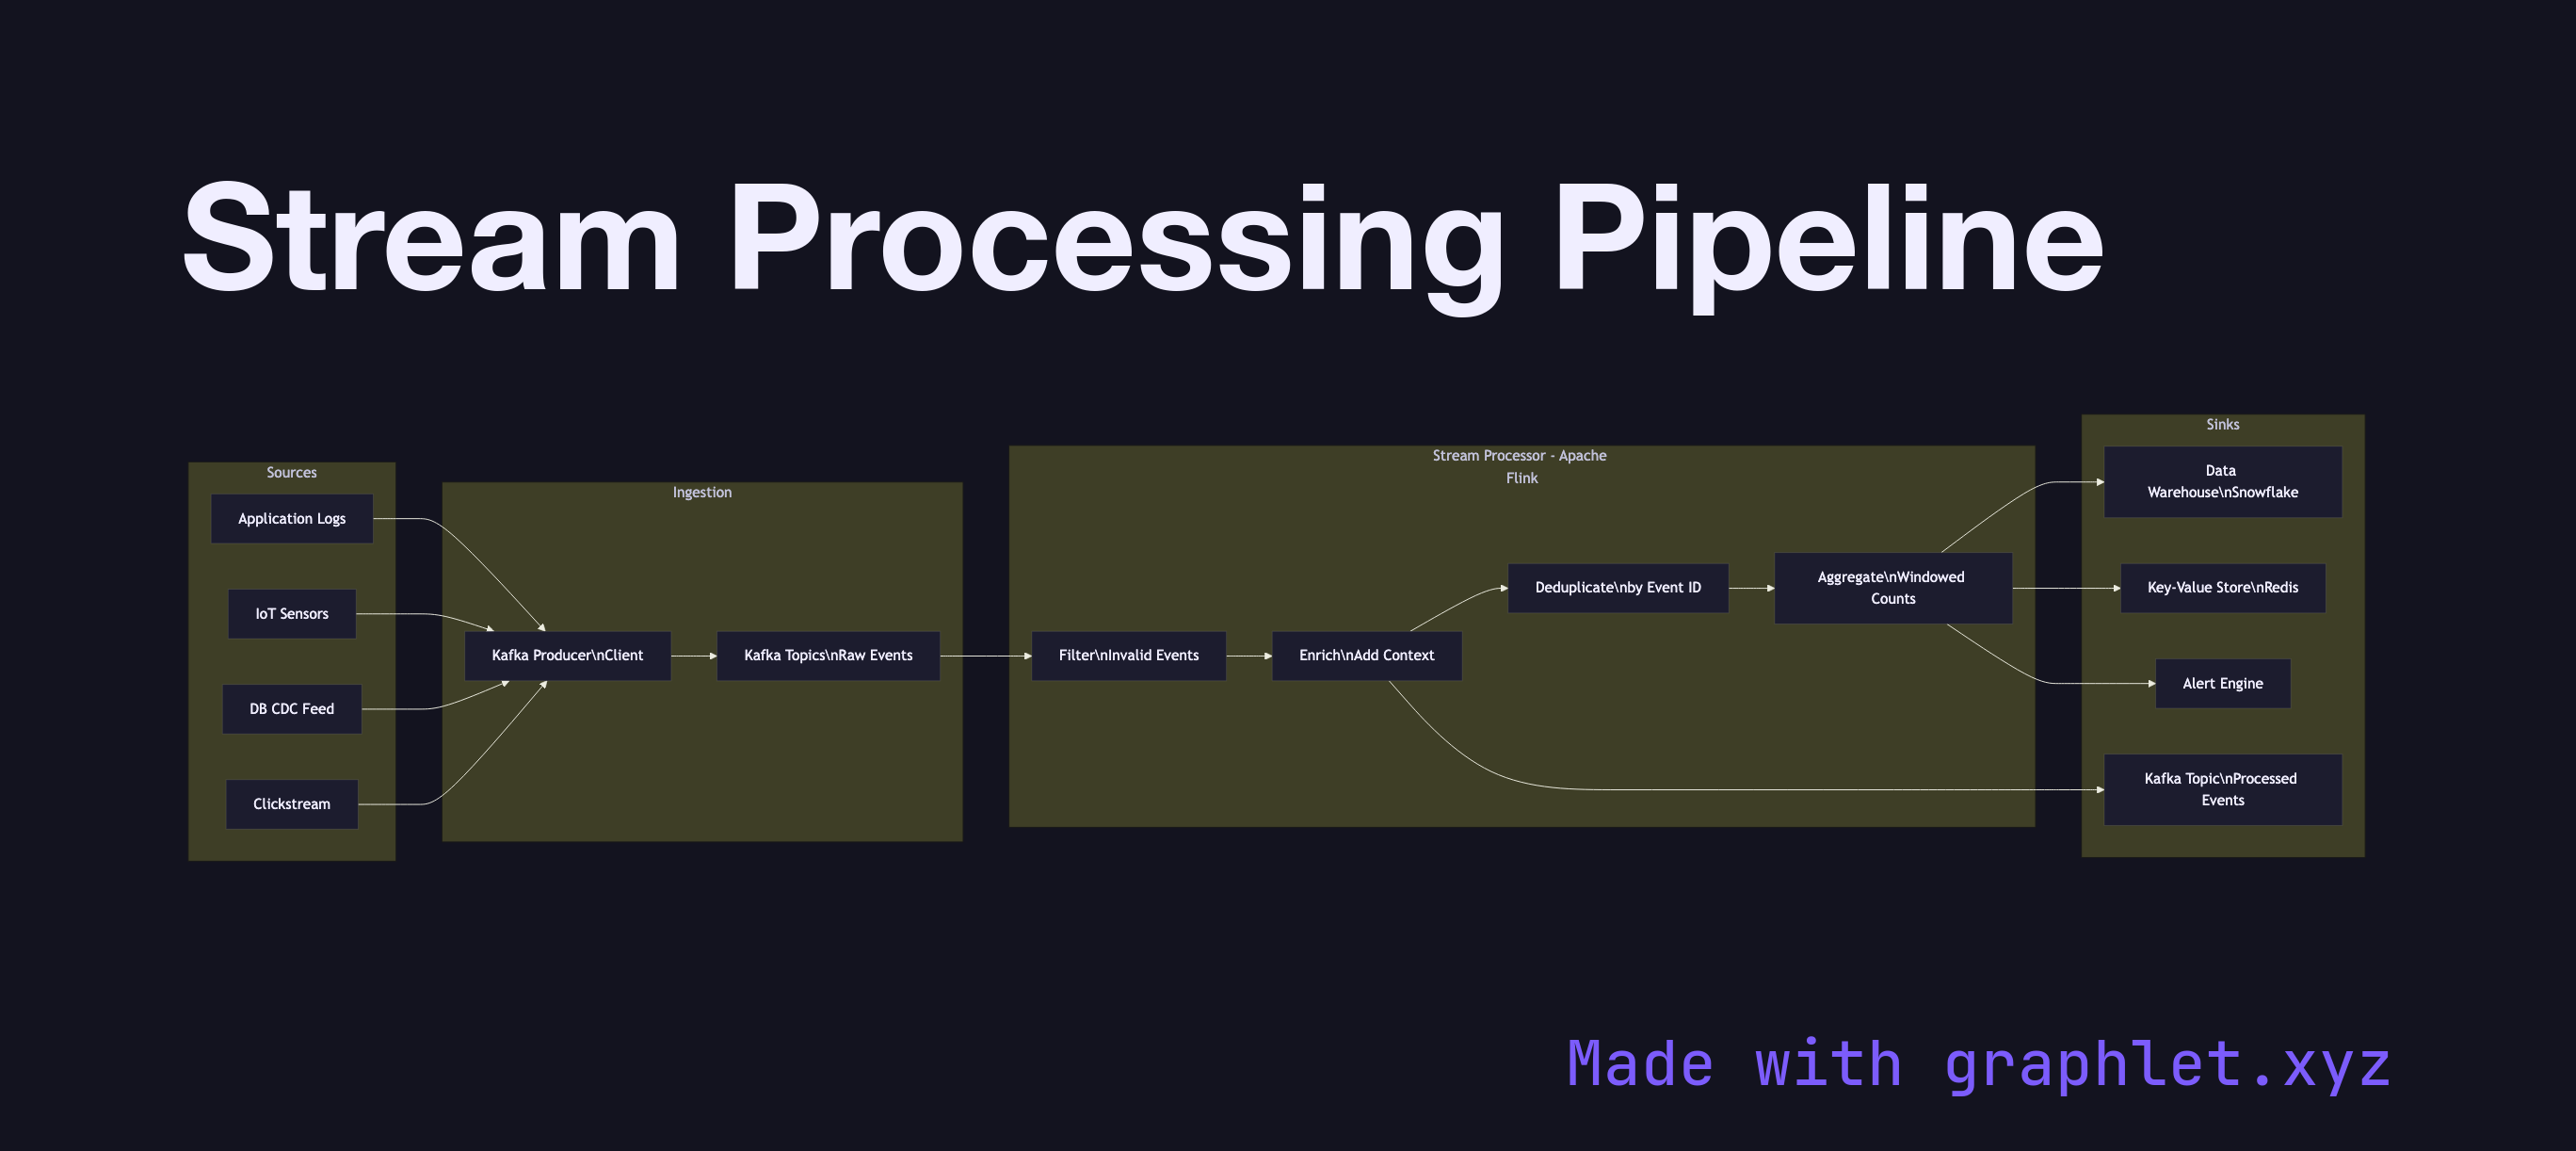
A pipeline has three logical stages. The ingestion layer accepts events from producers — application logs, IoT sensors, user click streams, database CDC feeds — and writes them to a durable event log (typically Kafka). Ingestion is designed for high throughput and low latency, often batching small messages to amortize network overhead.

The processing layer reads from the event log and applies stateless or stateful transformations. Stateless operations — filtering, mapping, format conversion — are simple: each event is transformed independently. Stateful operations — aggregations, joins across streams, sessionization — require the processor to maintain state, which introduces checkpointing for fault tolerance. Frameworks like Kafka Streams, Apache Flink, and Apache Spark Structured Streaming manage this complexity, including exactly-once processing guarantees tied to Exactly Once Delivery semantics.

The sink layer routes processed results to their destinations: a data warehouse for historical analysis, a key-value store for real-time lookups, a downstream Kafka topic for further processing, or a monitoring system for alerting. Message Deduplication at the sink prevents duplicate writes when processors retry after failures. The full architecture sits within the broader Event Streaming Architecture pattern.

Free online editor
Edit this diagram in Graphlet
Fork, modify, and export to SVG or PNG. No sign-up required.
Open in Graphlet →

Frequently asked questions

A stream processing pipeline is an architecture that continuously ingests, transforms, enriches, and routes high-throughput event data in real time, enabling outputs and decisions with latency measured in milliseconds. Unlike batch processing, which waits for a window to close before running computations, stream processing handles each event as it arrives.
The pipeline has three logical stages. The ingestion layer accepts events from producers and writes them to a durable event log such as Kafka. The processing layer reads from the log and applies stateless transformations (filtering, mapping) or stateful operations (aggregations, joins, sessionisation) using frameworks like Kafka Streams, Apache Flink, or Spark Structured Streaming, with checkpointing for fault tolerance. The sink layer routes results to downstream destinations — data warehouses, key-value stores, or further Kafka topics.
Use stream processing when your use case requires real-time decisions or outputs: fraud detection on transaction events, live leaderboards, dynamic pricing, operational dashboards, or anomaly detection. If results can tolerate minutes or hours of delay, batch processing is simpler. If results must be available in under a second, stream processing is the appropriate choice.
A common mistake is not accounting for late-arriving events — data that arrives after its expected window has closed. Without a watermarking and out-of-order event strategy, late data either corrupts aggregations or is silently dropped. Another pitfall is not checkpointing stateful processors frequently enough, resulting in long recovery times after failures. Teams also neglect deduplication at the sink, causing duplicate writes when processors retry failed operations.
mermaid
flowchart LR subgraph Sources APP[Application Logs] IOT[IoT Sensors] CDC[DB CDC Feed] CLICK[Clickstream] end subgraph Ingestion KP[Kafka Producer\nClient] KT[Kafka Topics\nRaw Events] end subgraph Processing[Stream Processor - Apache Flink] FIL[Filter\nInvalid Events] ENR[Enrich\nAdd Context] AGG[Aggregate\nWindowed Counts] DED[Deduplicate\nby Event ID] end subgraph Sinks DW[Data Warehouse\nSnowflake] KV[Key-Value Store\nRedis] AL[Alert Engine] KT2[Kafka Topic\nProcessed Events] end APP --> KP IOT --> KP CDC --> KP CLICK --> KP KP --> KT KT --> FIL FIL --> ENR ENR --> DED DED --> AGG AGG --> DW AGG --> KV AGG --> AL ENR --> KT2
Copied to clipboard