diagram.mmd — flowchart
Cloud Cost Monitoring Pipeline flowchart diagram

A cloud cost monitoring pipeline is the system that continuously collects billing and usage data from cloud provider APIs, enriches it with resource tags and team ownership, detects spending anomalies, and delivers actionable cost visibility to engineering and finance teams.

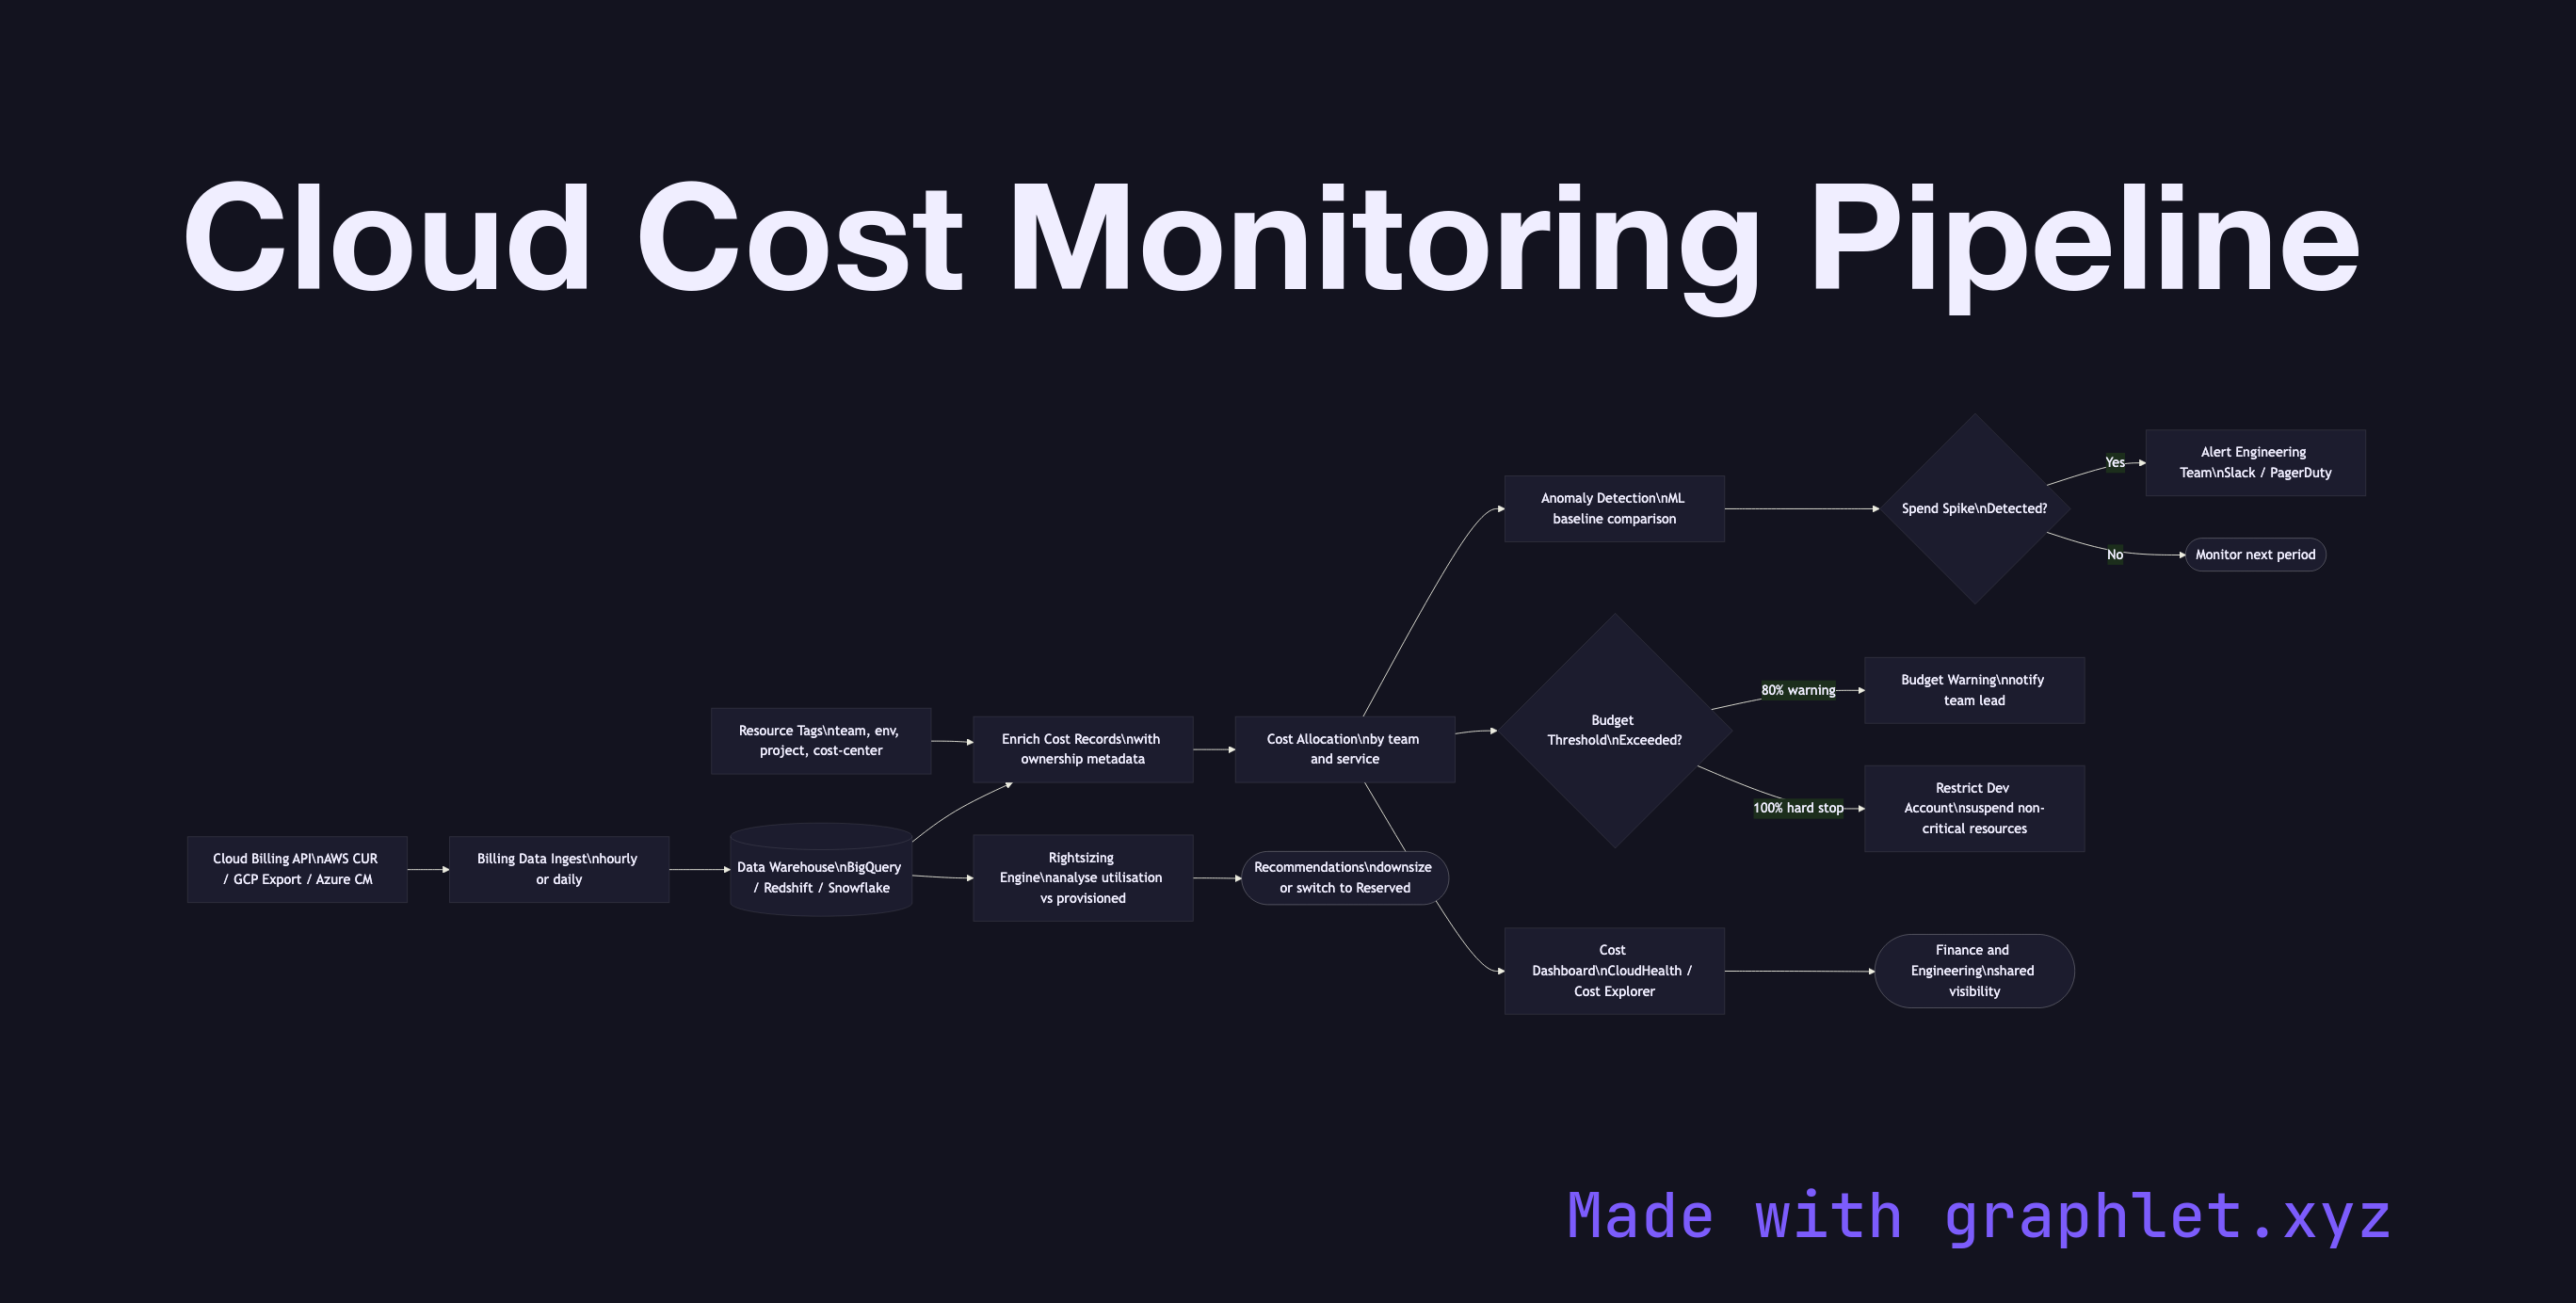
Cloud bills grow opaquely without deliberate cost observability. The pipeline begins with billing data collection: AWS Cost and Usage Reports (CUR), GCP Billing Export to BigQuery, or Azure Cost Management APIs produce detailed line-item records of every metered resource. These are exported to a data warehouse (Redshift, BigQuery, Snowflake) on a daily or hourly cadence.

Resource tagging is the foundation of cost allocation. Resources tagged with team, environment, project, and cost-center labels allow spend to be attributed to specific teams or features. Untagged resources are a common source of "mystery spend." A tagging compliance check in the Infrastructure as Code Pipeline prevents untagged resources from being deployed.

Anomaly detection compares current spend to historical baselines and ML-predicted forecasts. A sudden spike — a developer leaving a GPU cluster running, a misconfigured auto-scaling group launching hundreds of instances — triggers an alert before the bill arrives at month-end.

Budget alerts are configured per team or account with hard thresholds (e.g., alert at 80% of monthly budget, hard stop at 100% for dev accounts). Cost dashboards in tools like CloudHealth, Apptio, or AWS Cost Explorer give leadership and engineering teams shared visibility.

Rightsizing recommendations analyze utilization metrics from Cloud Monitoring Pipeline and flag over-provisioned instances, idle resources, and opportunities to switch to Reserved Instances or Savings Plans for predictable workloads.

Free online editor
Edit this diagram in Graphlet
Fork, modify, and export to SVG or PNG. No sign-up required.
Open in Graphlet →

Frequently asked questions

A cloud cost monitoring pipeline is the system that continuously collects billing and usage data from cloud provider APIs, enriches it with resource tags and ownership metadata, detects spending anomalies, and delivers actionable cost visibility to engineering and finance teams through dashboards and alerts.
Anomaly detection compares current spend to historical baselines and ML-predicted forecasts for each account, service, or tag group. When spend deviates significantly from the expected range — a spike caused by a runaway GPU cluster or a misconfigured auto-scaling group — an alert fires before the month-end bill arrives.
Use soft budget alerts at 50% and 80% of monthly budget to give teams early warning and time to act. Use hard stops (blocking further provisioning via SCPs) only for non-production accounts where runaway spend has no business justification. Never apply hard stops to production accounts, as blocking provisioning can cause outages.
Neglecting resource tagging is the most common failure — without consistent tags, spend cannot be attributed to teams or features. Other mistakes include reviewing costs monthly rather than daily (making anomalies too late to catch), not alerting on per-service cost spikes (relying only on total account spend), and ignoring data transfer costs which often surprise teams at scale.
mermaid
flowchart LR BillingAPI[Cloud Billing API\nAWS CUR / GCP Export / Azure CM] --> Ingest[Billing Data Ingest\nhourly or daily] Ingest --> Warehouse[(Data Warehouse\nBigQuery / Redshift / Snowflake)] Tags[Resource Tags\nteam, env, project, cost-center] --> Enrich[Enrich Cost Records\nwith ownership metadata] Warehouse --> Enrich Enrich --> Allocate[Cost Allocation\nby team and service] Allocate --> Dashboard[Cost Dashboard\nCloudHealth / Cost Explorer] Allocate --> AnomalyDetect[Anomaly Detection\nML baseline comparison] AnomalyDetect --> Spike{Spend Spike\nDetected?} Spike -->|Yes| Alert[Alert Engineering Team\nSlack / PagerDuty] Spike -->|No| Continue([Monitor next period]) Allocate --> BudgetCheck{Budget Threshold\nExceeded?} BudgetCheck -->|80% warning| WarnAlert[Budget Warning\nnotify team lead] BudgetCheck -->|100% hard stop| HardStop[Restrict Dev Account\nsuspend non-critical resources] Warehouse --> Rightsizing[Rightsizing Engine\nanalyse utilisation vs provisioned] Rightsizing --> Recommendations([Recommendations\ndownsize or switch to Reserved]) Dashboard --> Finance([Finance and Engineering\nshared visibility])
Copied to clipboard