diagram.mmd — flowchart
Cloud Monitoring Pipeline flowchart diagram

A cloud monitoring pipeline is the infrastructure that continuously collects metrics from compute, network, and application resources, aggregates them into a time-series store, and drives dashboards, alerts, and automated responses like auto-scaling.

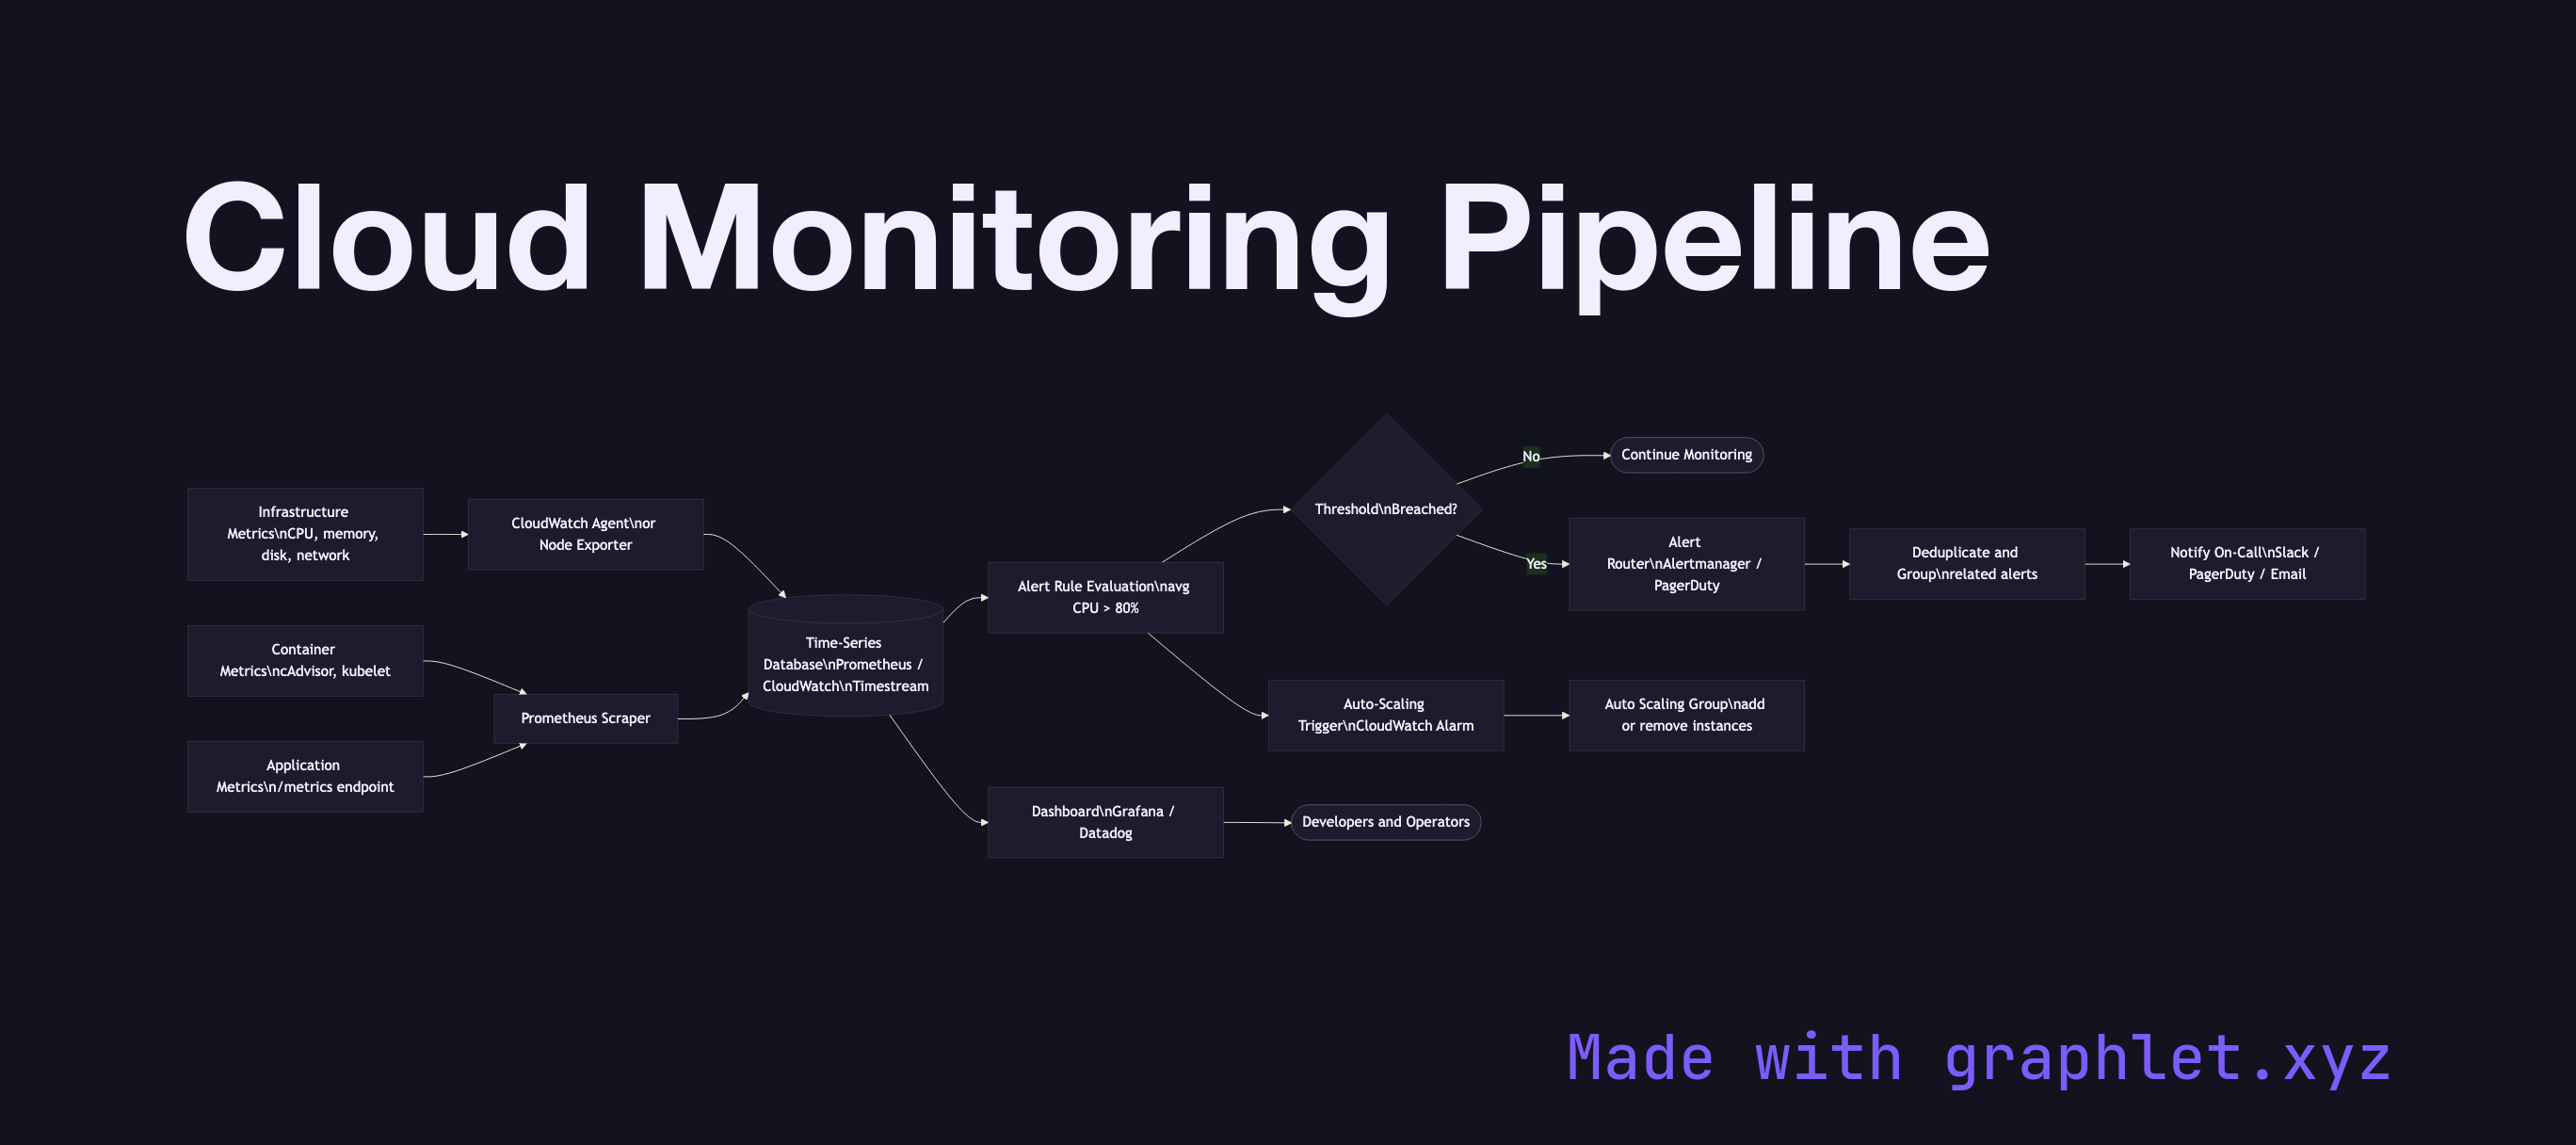
Metrics originate at every layer of the stack. Infrastructure metrics — CPU utilization, memory, disk I/O, network throughput — are collected by the cloud provider's hypervisor and agent. Container metrics (pod CPU, memory limits vs. requests, pod restarts) come from cAdvisor embedded in the kubelet. Application metrics are emitted by the service itself using a metrics library (Prometheus client, StatsD, OpenTelemetry SDK) and expose a /metrics endpoint or push to a collector.

Collection agents (Prometheus, CloudWatch Agent, Datadog Agent, OpenTelemetry Collector) scrape or receive metrics and forward them to a time-series database (Prometheus TSDB, Amazon Timestream, Google Cloud Monitoring, InfluxDB). Metrics are labeled with dimensions — service, environment, region — enabling slicing and aggregation.

Dashboards (Grafana, CloudWatch dashboards, Datadog) visualize trends and spot anomalies. Alert rules evaluate metric expressions at intervals (e.g., avg(cpu_usage[5m]) > 80). When thresholds breach, alerts fire to an alerting router (Alertmanager, PagerDuty) which deduplicates, groups, and routes notifications to the on-call team.

Critically, the monitoring pipeline also feeds auto-scaling decisions — CloudWatch alarms or custom metrics trigger scaling policies directly. See Auto Scaling Workflow for the downstream effect, and Cloud Logging Pipeline for the parallel observability stream for log data.

Free online editor
Edit this diagram in Graphlet
Fork, modify, and export to SVG or PNG. No sign-up required.
Open in Graphlet →

Frequently asked questions

A cloud monitoring pipeline is the infrastructure that continuously collects metrics from compute, network, and application resources, stores them in a time-series database, and drives dashboards, alert rules, and automated responses such as auto-scaling. It is the foundational observability layer for any production cloud system.
Agents or exporters scrape metrics from services and forward them to a time-series store labeled with dimensions like service and region. Alert rules evaluate metric expressions at regular intervals — for example, average CPU over 5 minutes exceeding 80%. When a threshold breaches, an alert fires to a routing layer that deduplicates and delivers notifications to on-call teams via PagerDuty or Slack.
Pull-based collection (Prometheus scraping `/metrics` endpoints) works well for internal services in a controlled network where the collector can reach every target. Push-based collection (StatsD, CloudWatch Agent, OTel push) is better for short-lived workloads like Lambda functions or batch jobs that don't live long enough to be scraped on a regular interval.
Alerting on every metric threshold rather than symptoms (user-visible impact) leads to alert fatigue. Missing baseline data for new services makes it impossible to detect anomalies. Not labeling metrics with consistent dimensions prevents meaningful aggregation. Storing raw high-resolution metrics indefinitely rather than rolling up to coarser resolutions over time generates unnecessarily high storage costs.
mermaid
flowchart LR Infra[Infrastructure Metrics\nCPU, memory, disk, network] --> Agent1[CloudWatch Agent\nor Node Exporter] Containers[Container Metrics\ncAdvisor, kubelet] --> Agent2[Prometheus Scraper] AppMetrics[Application Metrics\n/metrics endpoint] --> Agent2 Agent1 --> TSDB[(Time-Series Database\nPrometheus / CloudWatch\nTimestream)] Agent2 --> TSDB TSDB --> Dashboard[Dashboard\nGrafana / Datadog] TSDB --> AlertRules[Alert Rule Evaluation\navg CPU > 80%] AlertRules --> Breach{Threshold\nBreached?} Breach -->|No| Continue([Continue Monitoring]) Breach -->|Yes| AlertRouter[Alert Router\nAlertmanager / PagerDuty] AlertRouter --> Deduplicate[Deduplicate and Group\nrelated alerts] Deduplicate --> Notify[Notify On-Call\nSlack / PagerDuty / Email] AlertRules --> ScalingTrigger[Auto-Scaling Trigger\nCloudWatch Alarm] ScalingTrigger --> ASG[Auto Scaling Group\nadd or remove instances] Dashboard --> Operators([Developers and Operators])
Copied to clipboard