diagram.mmd — flowchart
High Availability System flowchart diagram

A high availability (HA) system is designed to minimize downtime by eliminating single points of failure, using redundancy at every tier so that the failure of any single component does not cause a service outage.

What the diagram shows

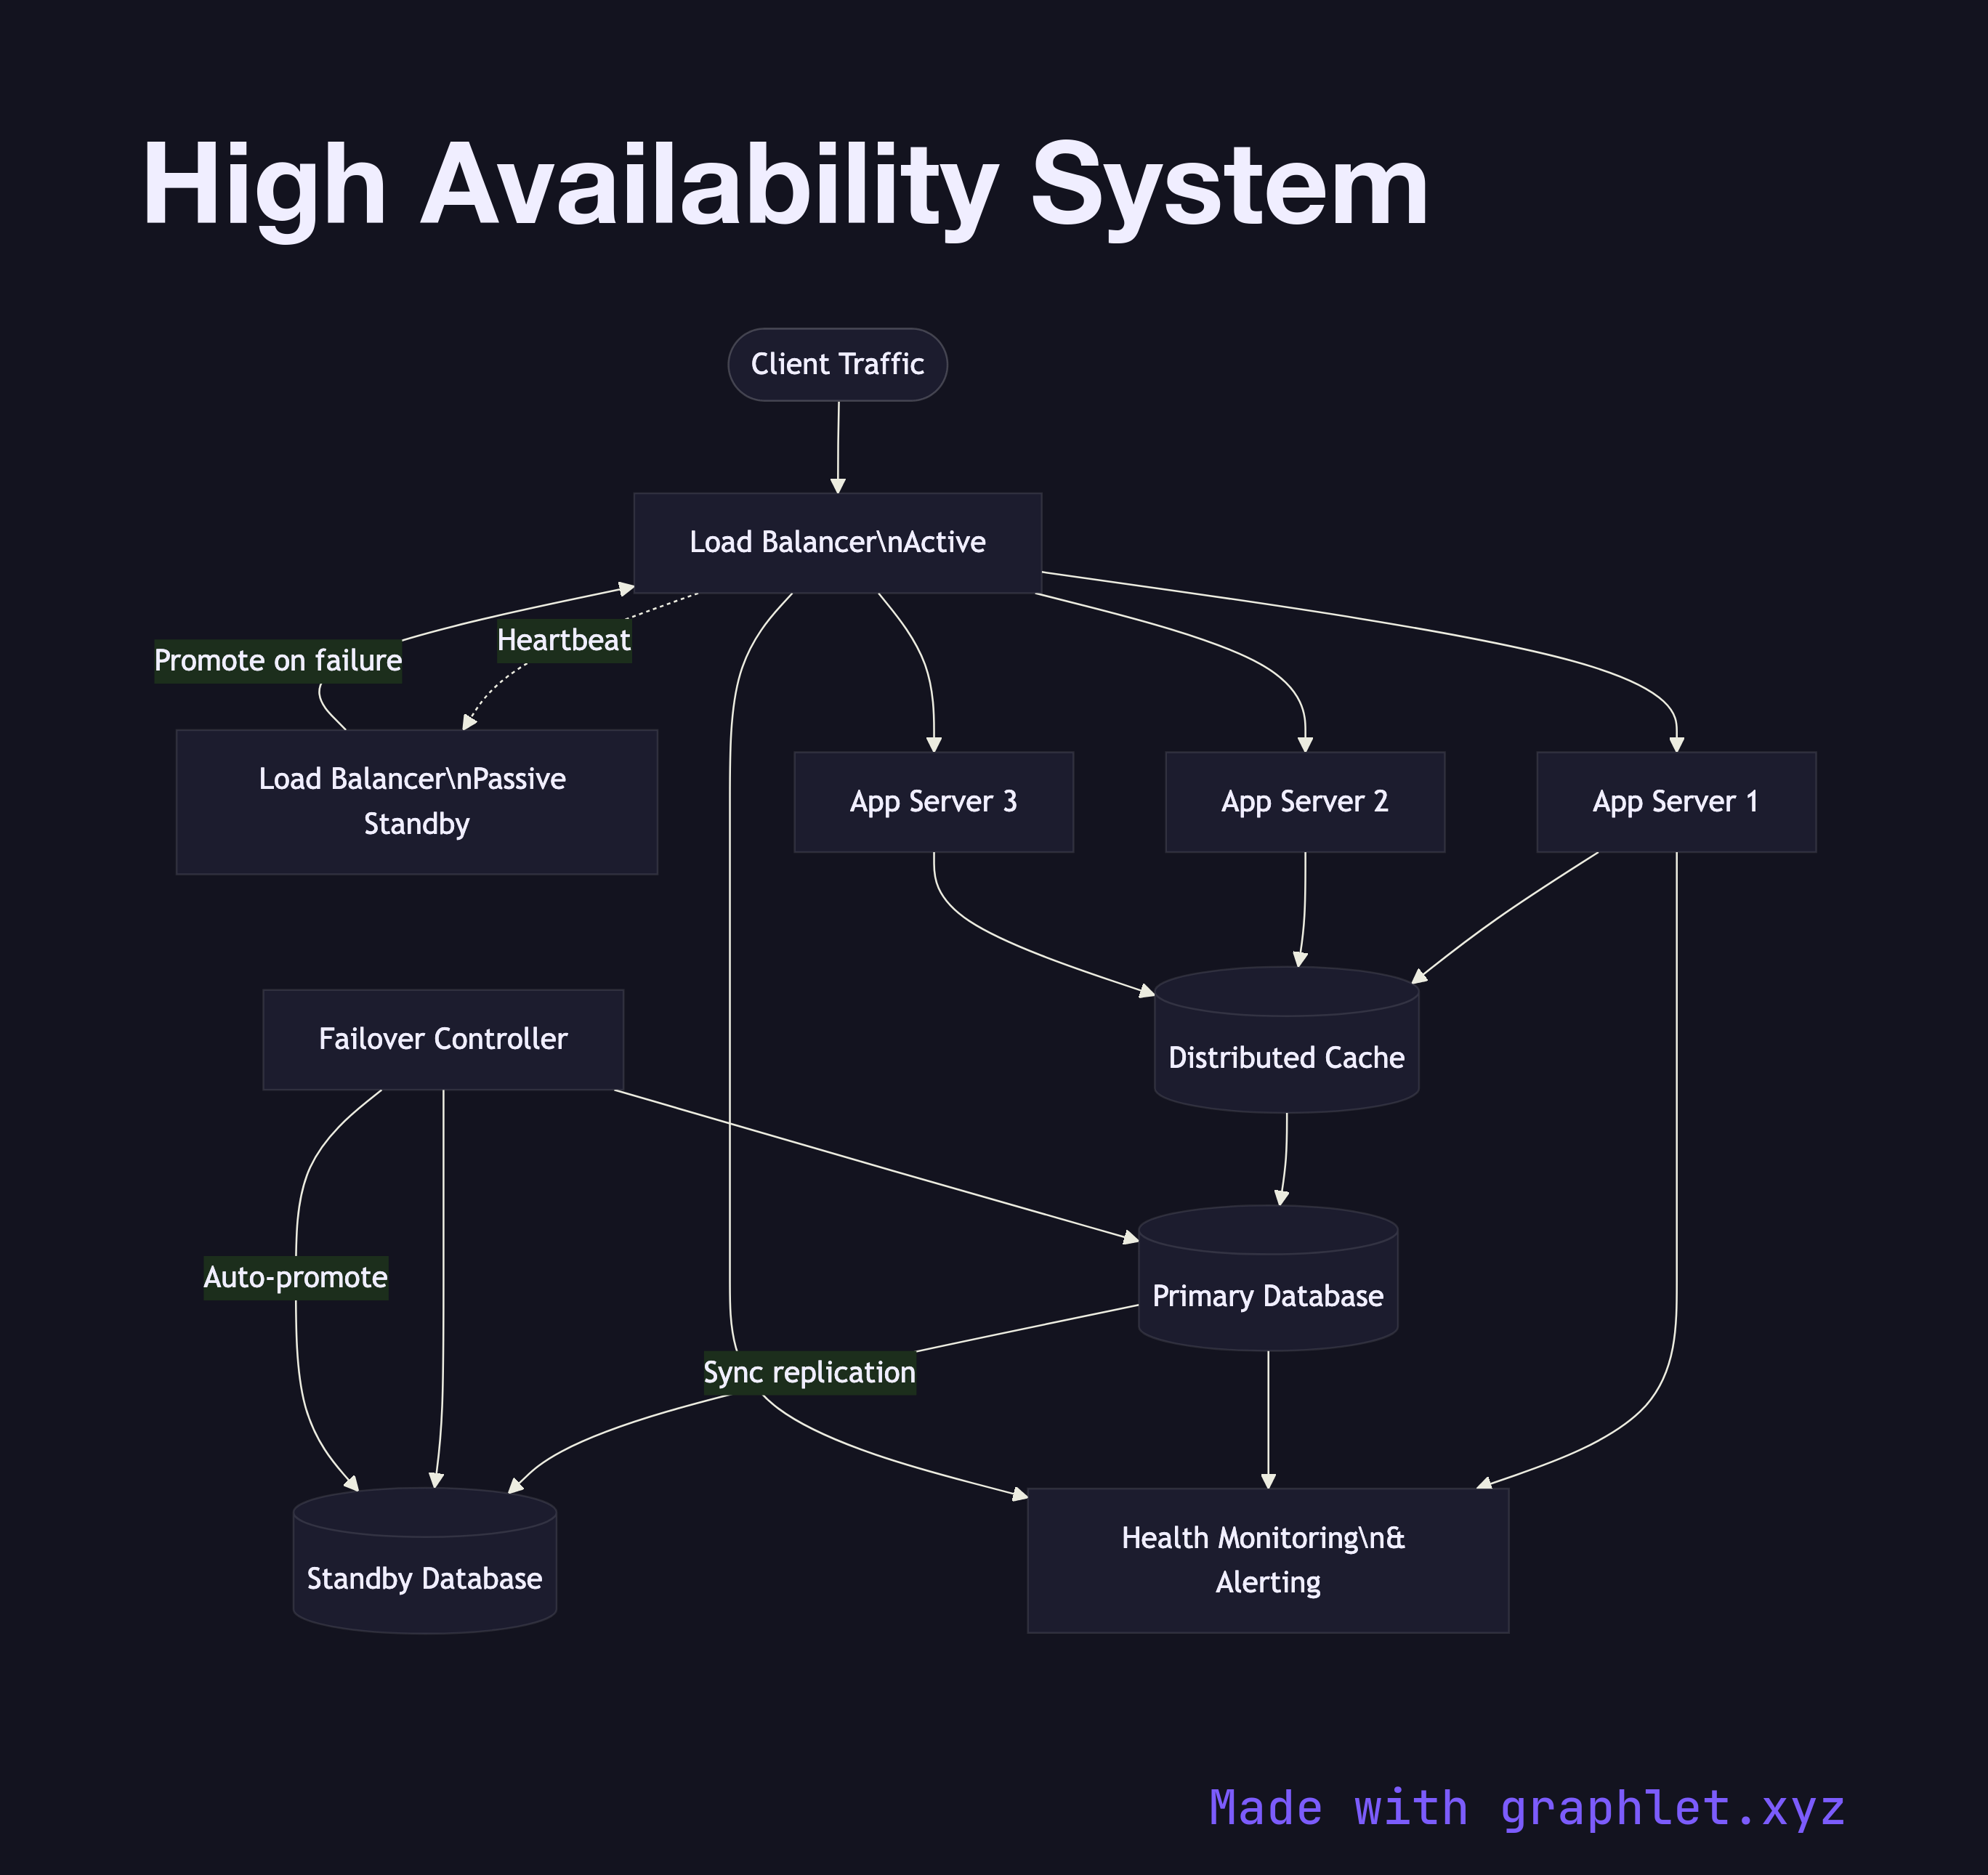
The diagram shows redundancy applied at each layer of the stack. Two Load Balancers operate in an active-passive configuration: the active LB handles all traffic while the passive LB monitors via a heartbeat and promotes itself if the active fails. Behind the load balancers, three Application Servers run in parallel; any two can fail and the service continues.

At the data tier, a Primary Database replicates synchronously to a Standby Database. A Failover Controller (e.g. Patroni, AWS RDS Multi-AZ) monitors both nodes and performs automatic promotion of the standby if the primary becomes unavailable. A shared Distributed Cache reduces database load. All health signals feed into a Health Monitoring system that triggers alerts and automated failover procedures.

Why this matters

High availability is typically expressed as a percentage uptime (99.9% = ~8.7 hours downtime/year; 99.99% = ~52 minutes/year). Each additional nine requires eliminating one more class of failure. The most impactful steps are: redundant load balancers, application server pools, and synchronous database replication with automated failover. For the cross-region extension of this pattern, see Multi Region Deployment. For the failover procedure in detail, see System Failover Architecture.

Free online editor
Edit this diagram in Graphlet
Fork, modify, and export to SVG or PNG. No sign-up required.
Open in Graphlet →

Frequently asked questions

A high availability (HA) system is designed to minimize unplanned downtime by eliminating single points of failure through redundancy at every tier — load balancers, application servers, and databases — so that the failure of any one component does not cause a service outage.
Redundancy is applied at each layer: active-passive load balancers with heartbeat monitoring, multiple application servers behind the load balancer, and a primary database that replicates synchronously to a standby. A failover controller automatically promotes the standby to primary when the primary fails, with health monitoring triggering alerts throughout.
Design for HA when your service has uptime SLAs above 99.9%, when downtime has direct business cost (e-commerce, financial services, SaaS), or when manual recovery would take longer than your acceptable recovery time objective (RTO).
Common mistakes include eliminating single points of failure at the application tier but overlooking them in the database or load balancer layer, using asynchronous replication (which risks data loss on failover), and not testing automated failover regularly — discovering it doesn't work during an actual outage.
mermaid
flowchart TD Client([Client Traffic]) --> LB_Active[Load Balancer\nActive] LB_Active -.->|Heartbeat| LB_Passive[Load Balancer\nPassive Standby] LB_Passive -->|Promote on failure| LB_Active LB_Active --> App1[App Server 1] LB_Active --> App2[App Server 2] LB_Active --> App3[App Server 3] App1 --> Cache[(Distributed Cache)] App2 --> Cache App3 --> Cache Cache --> PrimaryDB[(Primary Database)] PrimaryDB -->|Sync replication| StandbyDB[(Standby Database)] FC[Failover Controller] --> PrimaryDB FC --> StandbyDB FC -->|Auto-promote| StandbyDB App1 --> HealthMon[Health Monitoring\n& Alerting] PrimaryDB --> HealthMon LB_Active --> HealthMon
Copied to clipboard