Log Aggregation Pipeline
A log aggregation pipeline collects log output from every service, host, and container in the infrastructure, parses and enriches it, and ships it to a centralized store where engineers can search and analyze it during incidents or routine debugging.
A log aggregation pipeline collects log output from every service, host, and container in the infrastructure, parses and enriches it, and ships it to a centralized store where engineers can search and analyze it during incidents or routine debugging.
How the pipeline works
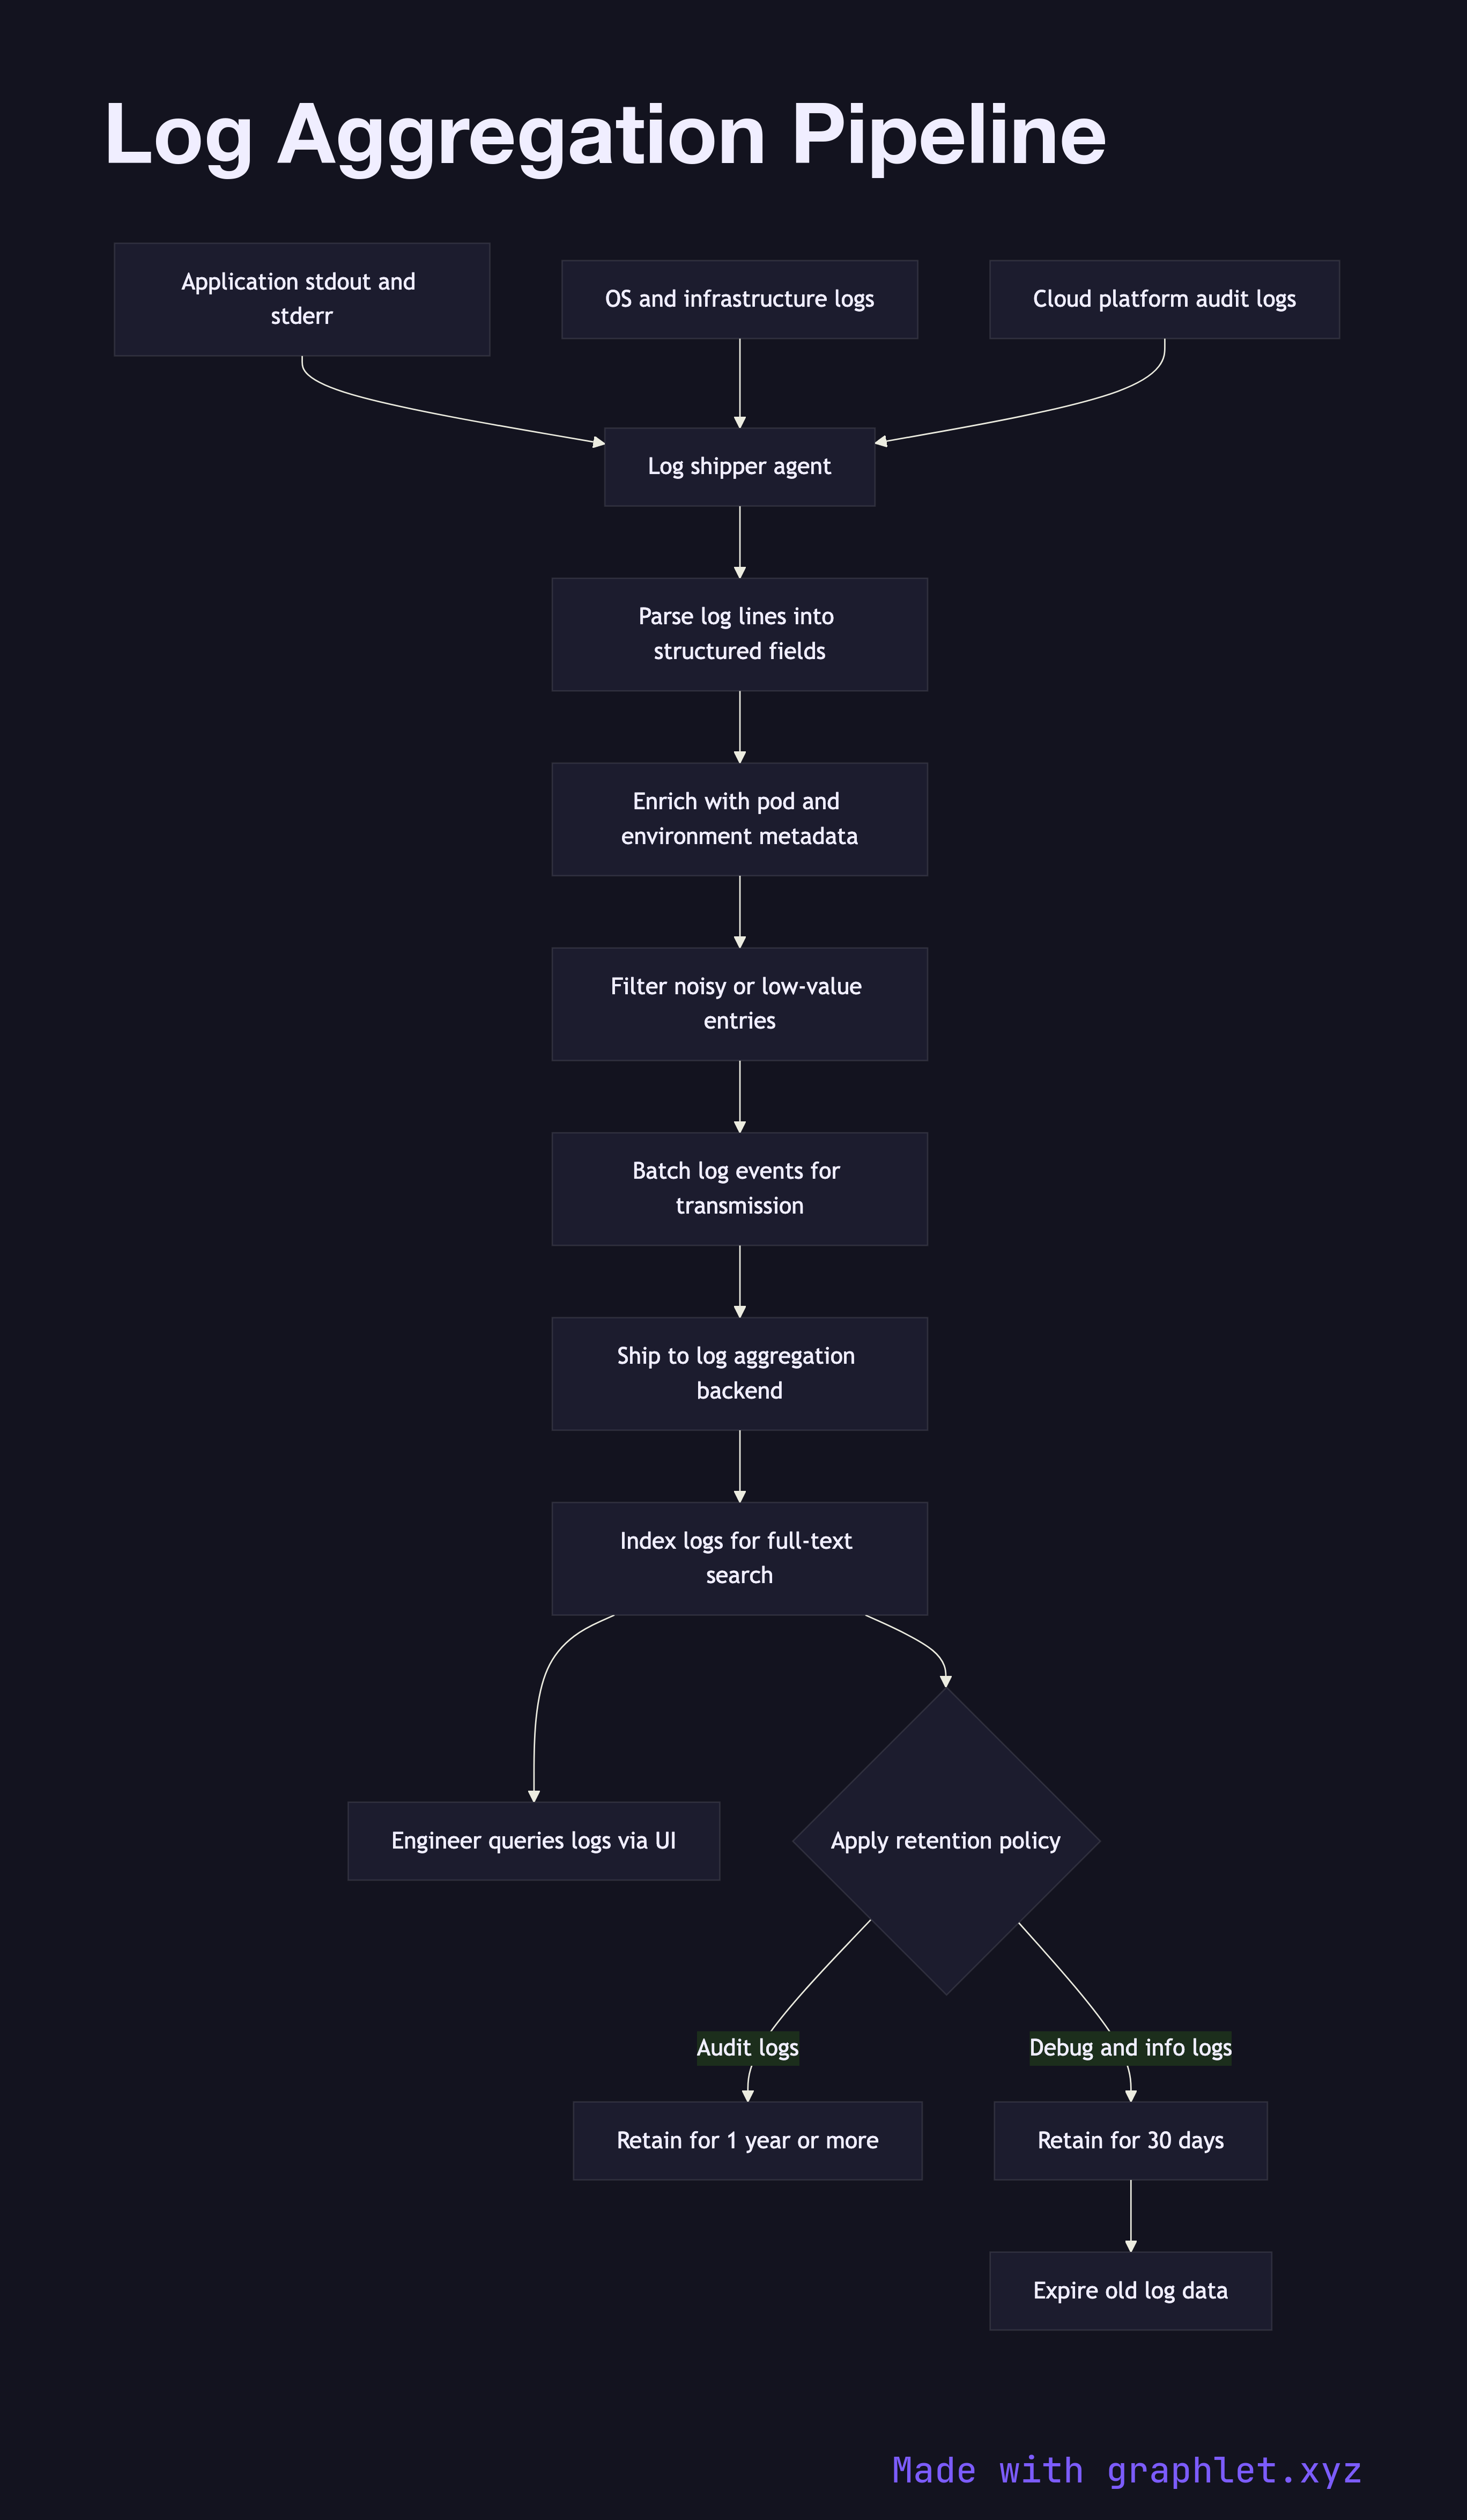
Log data originates from multiple sources simultaneously: application processes writing JSON or plaintext to stdout, web servers writing access logs, operating system daemons, and cloud platform services emitting audit events. Each source produces logs at its own rate and in its own format.
A log shipper (Fluentd, Fluent Bit, Filebeat, Promtail) runs as a DaemonSet or sidecar and tails log files or reads from the container runtime's log driver. The shipper parses each line, attempting to extract structured fields. JSON logs are parsed directly; plaintext logs are processed with regex or grok patterns to extract fields like timestamp, log level, service name, and request ID.
After parsing, the pipeline enriches each log record with contextual metadata: Kubernetes pod name, namespace, node, deployment version, and cloud region. This metadata is added from the environment the shipper is running in, not from the application itself, so enrichment works even for third-party services that cannot be instrumented.
Enriched log events are batched and forwarded to a log aggregation backend — Elasticsearch, OpenSearch, or Grafana Loki. The backend indexes the logs, making them searchable by any field. Engineers use a query interface (Kibana, Grafana) to filter logs by time range, service, log level, or correlation ID during incident investigations (see Incident Management Flow).
Retention policies control storage costs: debug and info logs may be retained for 30 days, while audit logs are retained for one year or longer per compliance requirements.