diagram.mmd — flowchart
Observability Pipeline flowchart diagram

An observability pipeline is the infrastructure that collects, processes, and routes the three pillars of observability — metrics, logs, and traces — from running services to the storage backends and visualization tools that engineers use to understand system behavior.

How the pipeline works

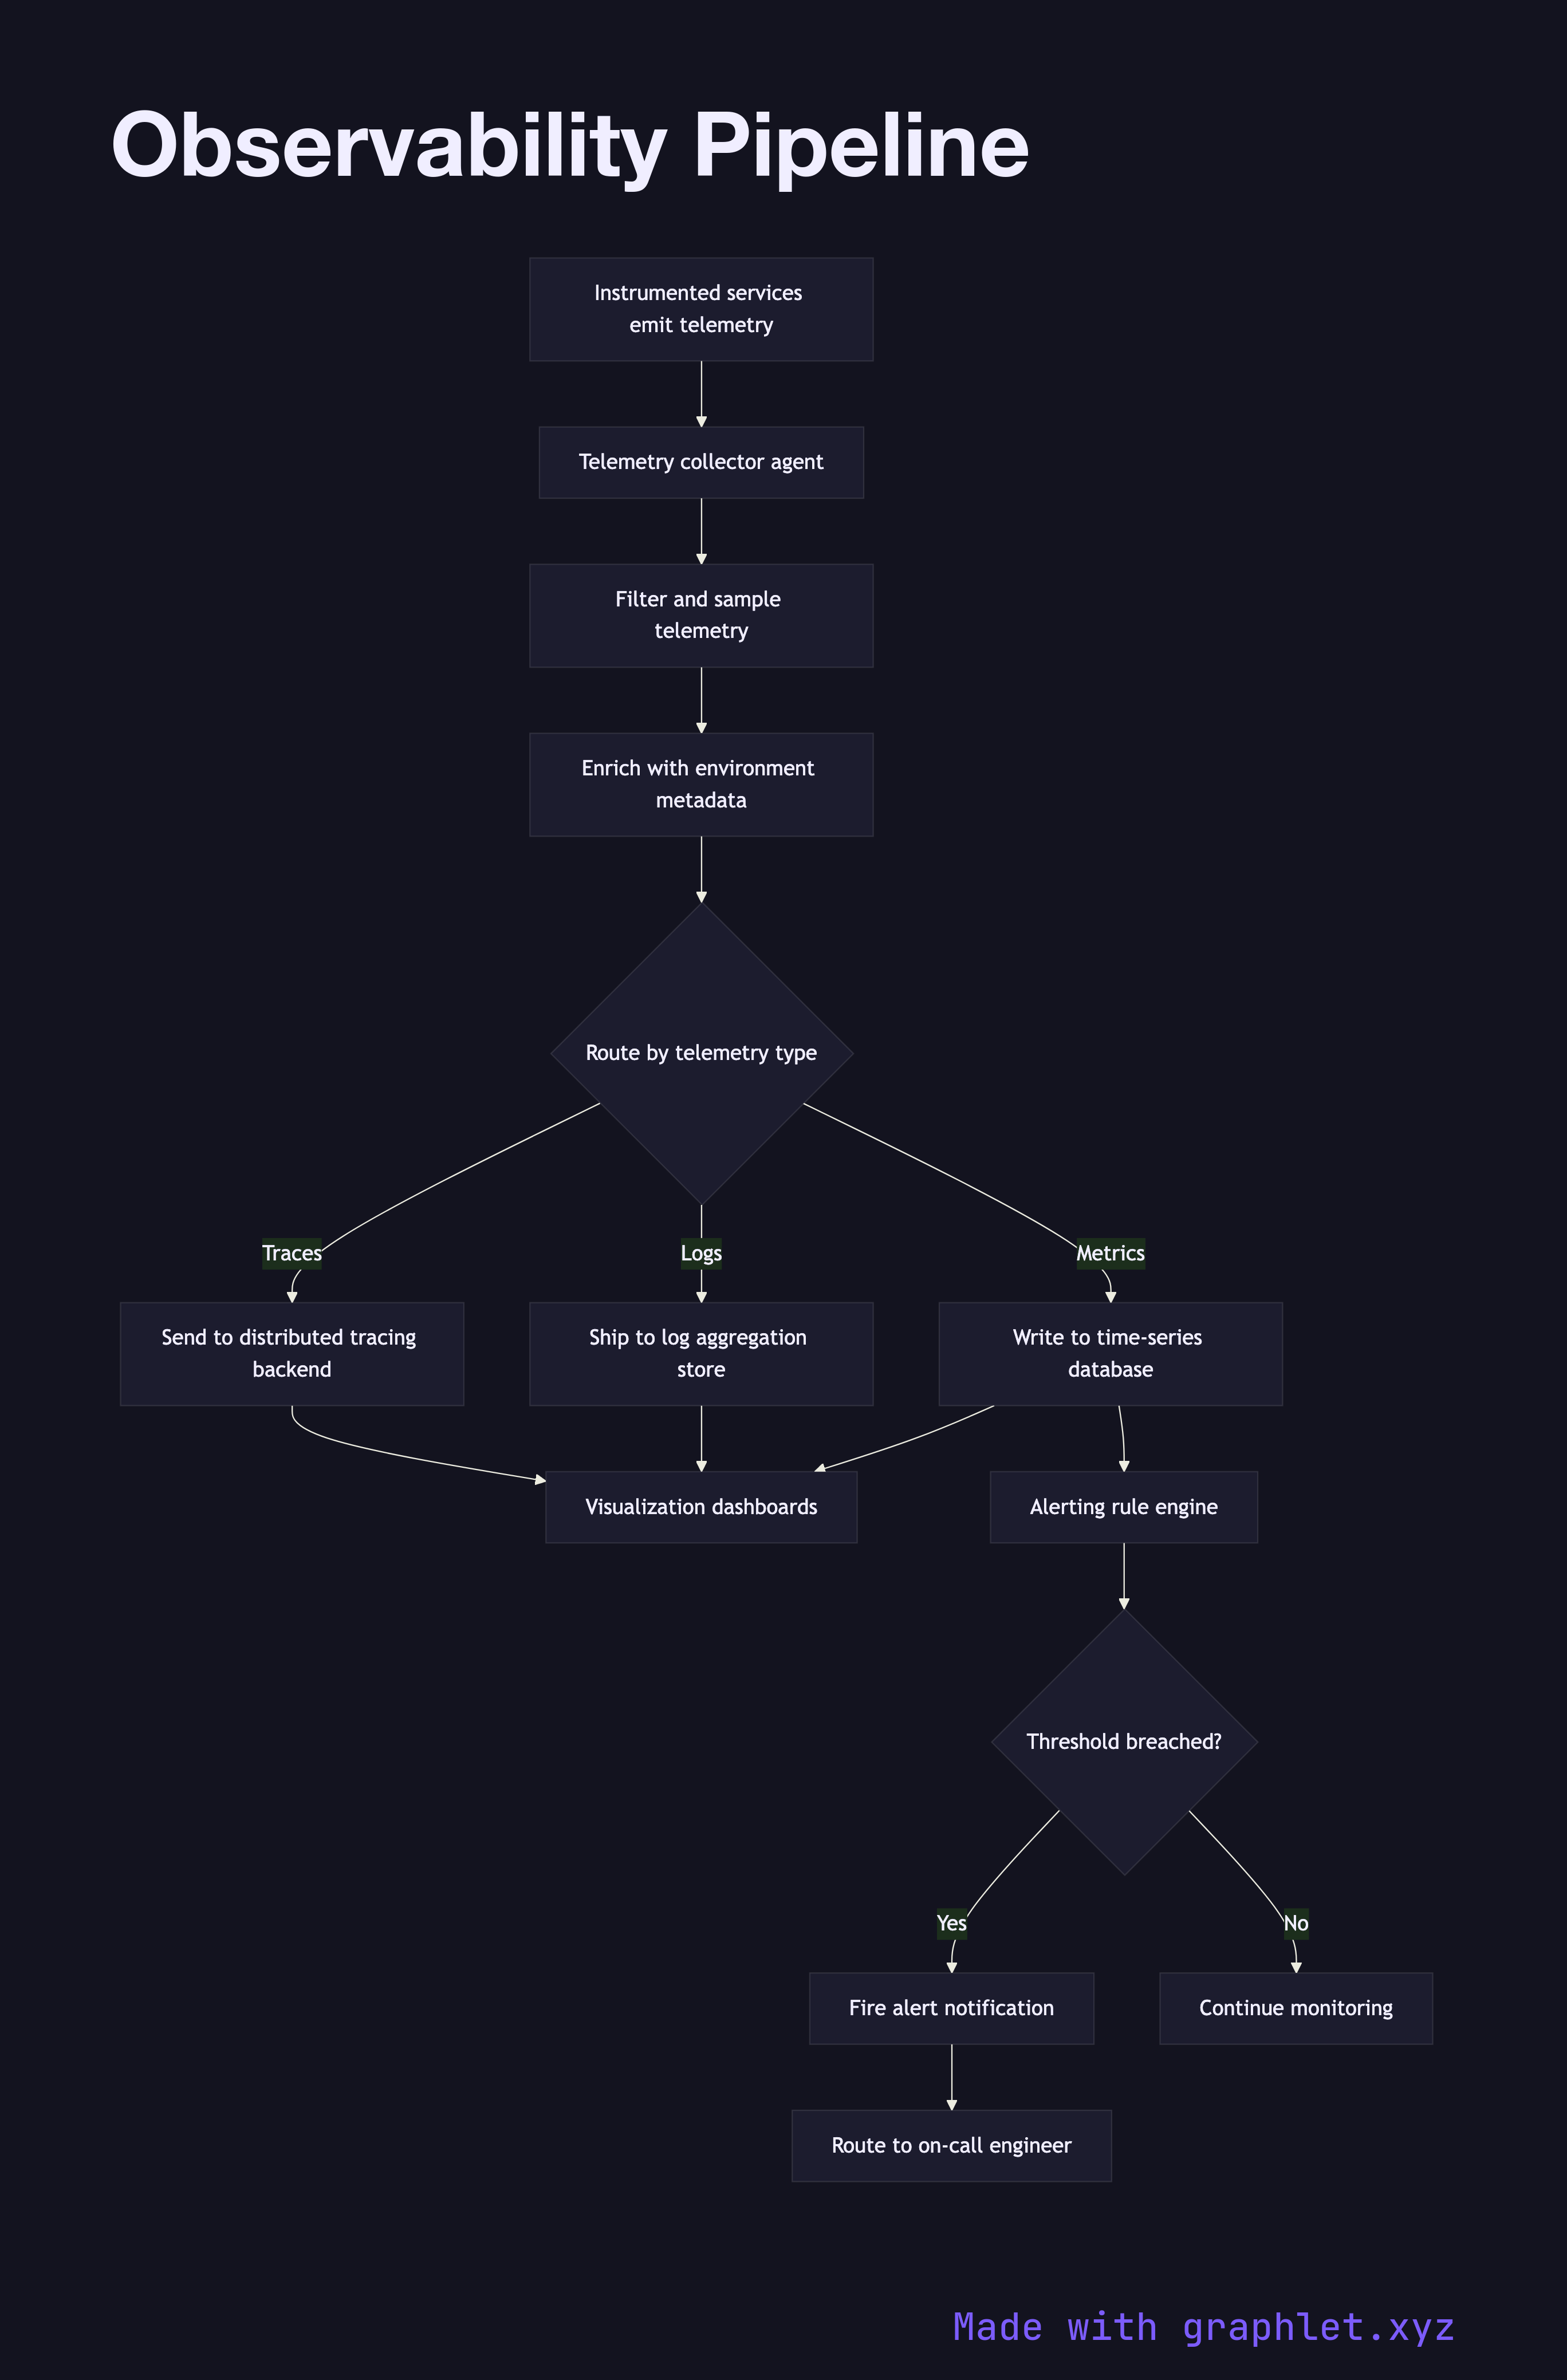
Every running service emits telemetry continuously. Application code is instrumented with an OpenTelemetry SDK or vendor agent that captures three data types:

- Metrics: numeric time-series data (request rates, error counts, CPU usage) emitted at regular intervals - Logs: structured or unstructured text records of discrete events, enriched with trace context - Traces: distributed trace spans that track a request across multiple services and show latency breakdowns

All three streams are collected by a telemetry collector agent running on each host or as a sidecar container. The collector performs initial processing: filtering out high-cardinality noise, sampling traces to a configurable rate, enriching records with environment metadata (service name, version, datacenter), and batching for efficient transmission.

Processed telemetry is then routed to specialized backends. Metrics are written to a time-series database like Prometheus or InfluxDB. Logs are shipped to an aggregation store like Elasticsearch or Loki (see Log Aggregation Pipeline). Traces are sent to a distributed tracing backend like Jaeger or Tempo.

A visualization layer (Grafana, Datadog, etc.) queries all three backends, allowing engineers to correlate a spike in the error rate metric with the specific log lines and the distributed trace that caused it. The alerting system subscribes to the metrics backend and fires notifications when thresholds are breached (see Alerting Workflow).

Free online editor
Edit this diagram in Graphlet
Fork, modify, and export to SVG or PNG. No sign-up required.
Open in Graphlet →

Frequently asked questions

An observability pipeline is the infrastructure that collects, processes, and routes the three pillars of observability — metrics, logs, and traces — from running services to the storage backends and visualization tools engineers use to understand system behavior.
Metrics are numeric time-series aggregates (request rate, error count, CPU usage) that are cheap to store and ideal for alerting. Logs are discrete event records that provide rich detail about what happened. Traces are distributed spans that track a single request across multiple services, revealing latency breakdowns and the call path.
Services are instrumented with the OpenTelemetry SDK, which emits metrics, logs, and traces. A collector agent running on each host filters, samples, and enriches the telemetry, then routes each signal type to its specialist backend — Prometheus for metrics, Loki or Elasticsearch for logs, Jaeger or Tempo for traces.
Always use sampling in production. Head-based sampling (deciding at the first span) is simpler; tail-based sampling (deciding after all spans for a trace arrive) lets you retain 100% of error traces and sample only successful traces. Without sampling, high-traffic services generate more trace data than most backends can store affordably.
Prometheus and Grafana are open-source and require self-hosting; they offer full control over retention and cost but demand operational investment. Datadog is a fully managed SaaS platform that unifies all three pillars in one product with minimal setup, at a per-host or per-ingestion pricing model that can become expensive at scale.
mermaid
flowchart TD Services[Instrumented services emit telemetry] --> Collector[Telemetry collector agent] Collector --> Filter[Filter and sample telemetry] Filter --> Enrich[Enrich with environment metadata] Enrich --> Route{Route by telemetry type} Route -->|Metrics| MetricsDB[Write to time-series database] Route -->|Logs| LogStore[Ship to log aggregation store] Route -->|Traces| TraceBackend[Send to distributed tracing backend] MetricsDB --> Dashboards[Visualization dashboards] LogStore --> Dashboards TraceBackend --> Dashboards MetricsDB --> AlertEngine[Alerting rule engine] AlertEngine --> ThresholdCheck{Threshold breached?} ThresholdCheck -->|Yes| FireAlert[Fire alert notification] ThresholdCheck -->|No| Continue[Continue monitoring] FireAlert --> OnCall[Route to on-call engineer]
Copied to clipboard