Metrics Collection
Metrics collection is the process of gathering numeric measurements from applications, runtimes, operating systems, and cloud infrastructure at regular intervals and storing them in a time-series database for querying, dashboarding, and alerting.
Metrics collection is the process of gathering numeric measurements from applications, runtimes, operating systems, and cloud infrastructure at regular intervals and storing them in a time-series database for querying, dashboarding, and alerting.
How metrics collection works
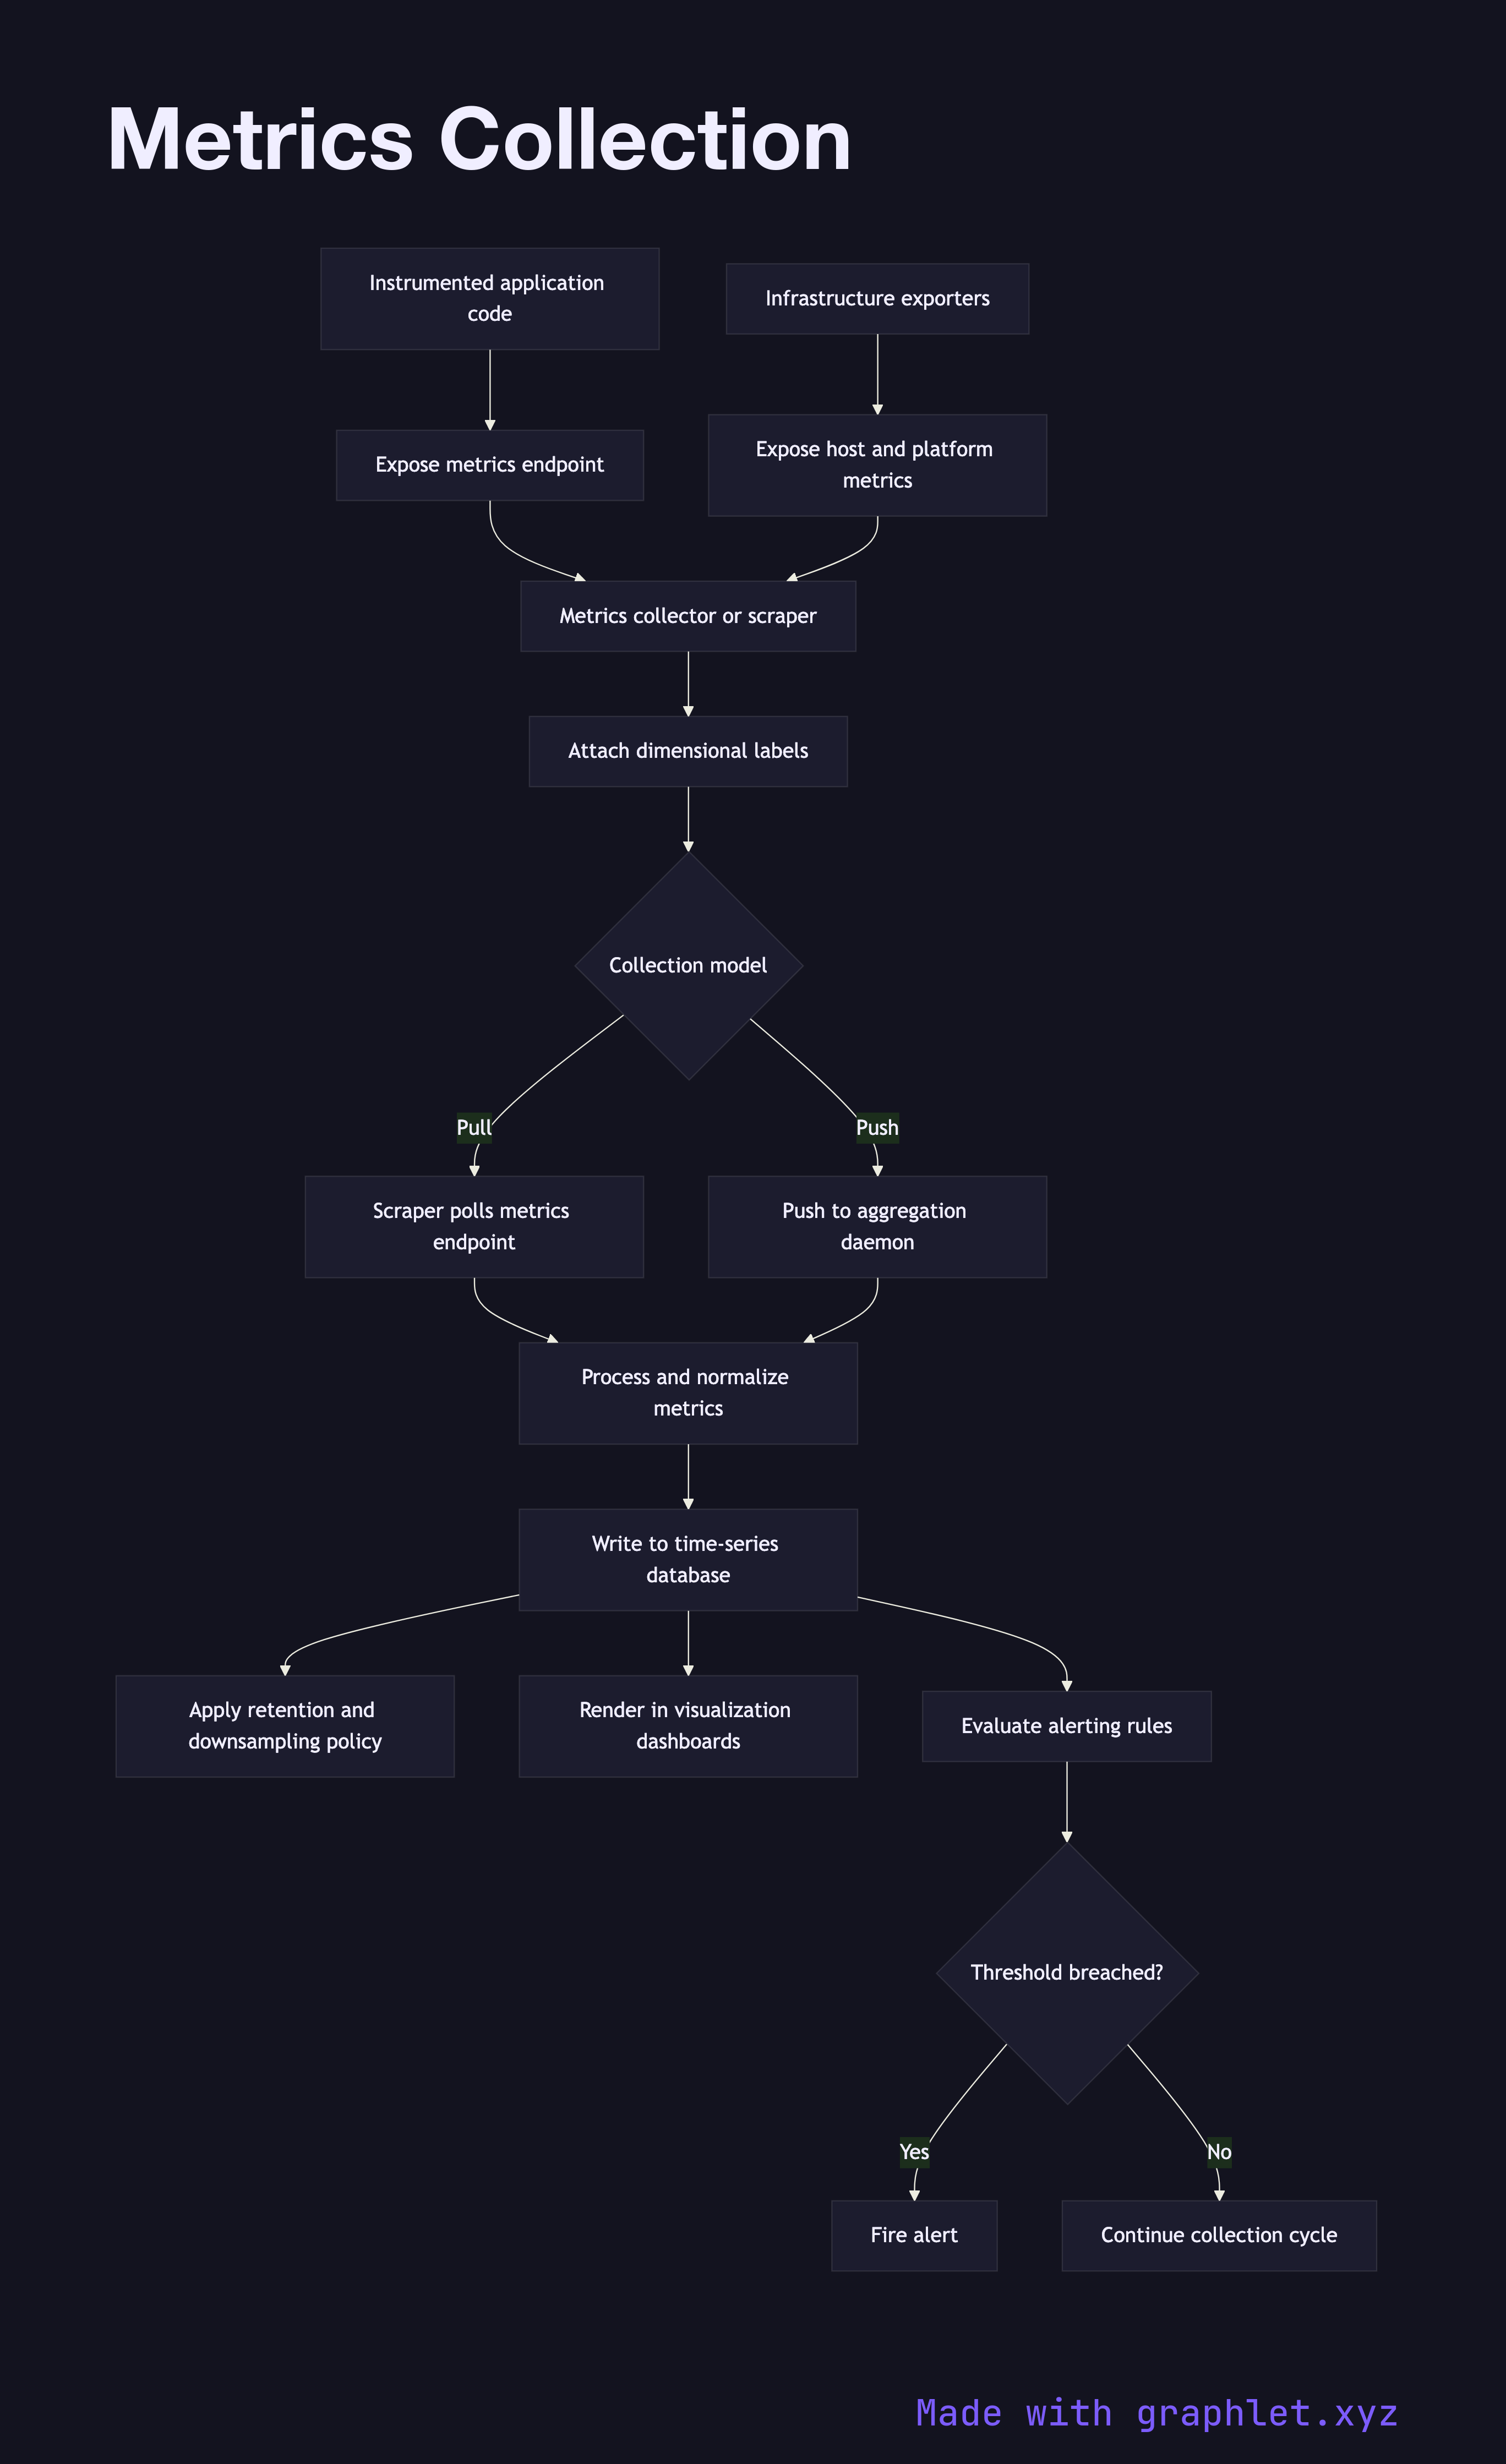
Metrics originate from two sources: instrumented application code and infrastructure exporters. Application code uses a metrics library (Prometheus client, StatsD, OpenTelemetry) to define and increment counters, gauges, and histograms. Infrastructure exporters (node_exporter, kube-state-metrics, cloud provider integrations) surface OS-level and platform-level metrics without code changes.
There are two collection models. In the pull model (used by Prometheus), a central scraper polls each service's /metrics HTTP endpoint on a configurable interval (e.g., every 15 seconds), fetching the current metric snapshot. In the push model (used by StatsD, InfluxDB line protocol), services emit metric events to an aggregation daemon, which batches and forwards them.
Regardless of model, raw metrics pass through a processing stage that attaches labels — environment name, service version, host, region — enriching each data point with dimensional context. These labels are critical for filtering and aggregating data in dashboards (e.g., error rate per service per region).
Processed metrics are written to a time-series database. Prometheus uses a local TSDB; cloud-native setups use managed services like Amazon CloudWatch or Google Cloud Monitoring. Older data is downsampled or expired according to retention policies.
The stored metrics feed two consumers: visualization dashboards that render time-series graphs, and the alerting engine that evaluates threshold rules (see Alerting Workflow) and fires pages when SLOs are breached.