diagram.mmd — flowchart
Web Performance Optimization flowchart diagram

Web performance optimization is the systematic process of identifying and resolving bottlenecks across the full lifecycle of a page — from the first network byte to a smooth interactive experience — to improve Core Web Vitals and user-perceived speed.

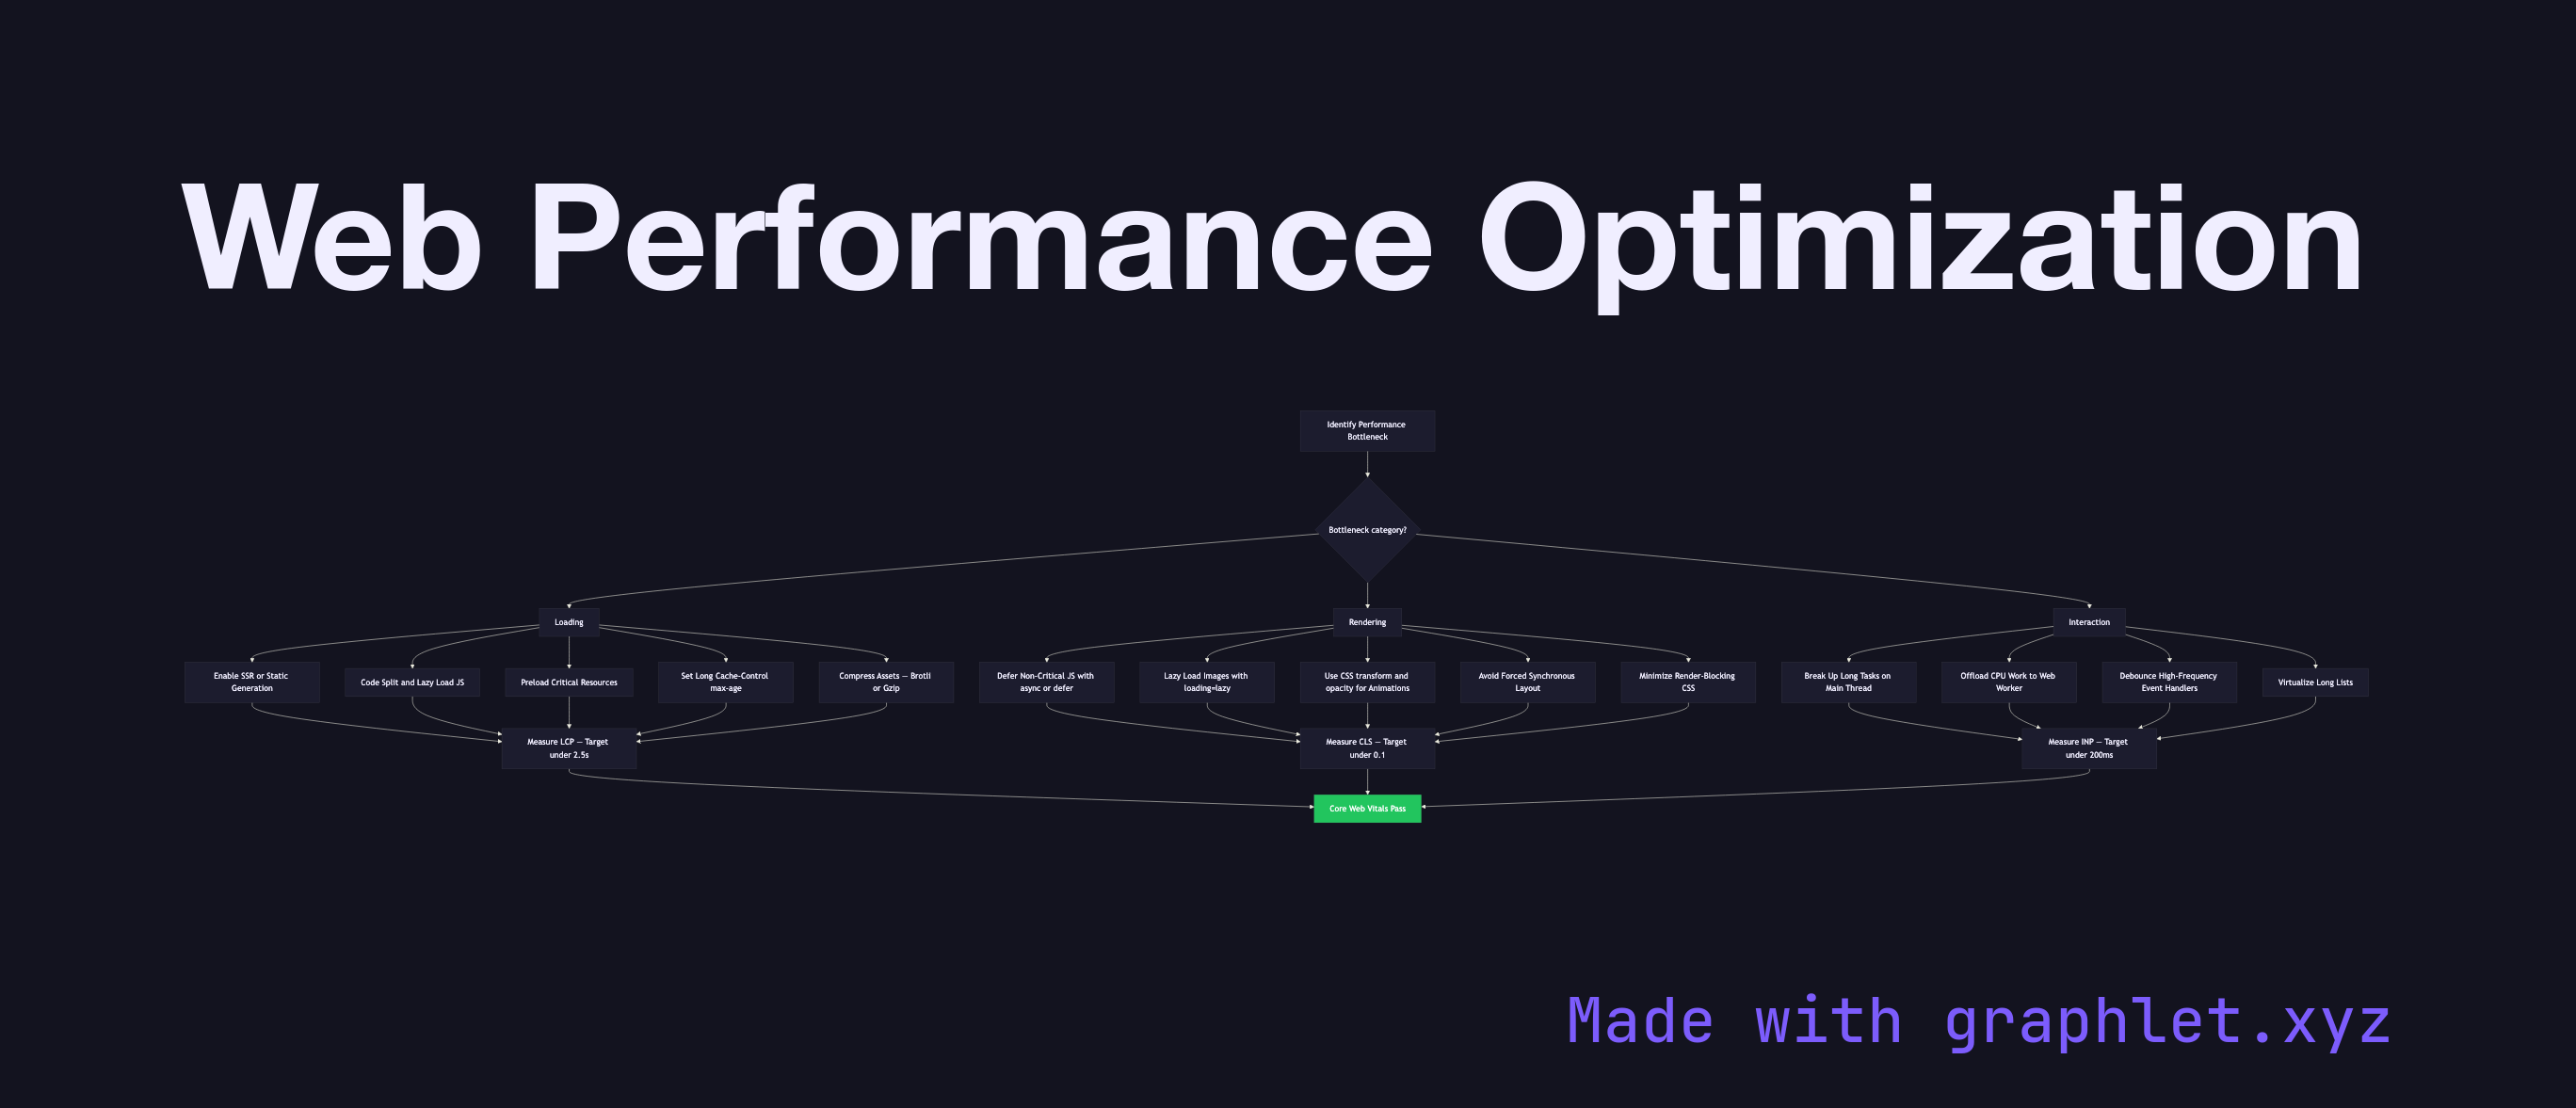
Performance work is most effective when guided by metrics. The three Core Web Vitals defined by Google are: Largest Contentful Paint (LCP) — how quickly the largest visible content element renders (target: under 2.5 s); Cumulative Layout Shift (CLS) — how much unexpected layout movement occurs (target: under 0.1); and Interaction to Next Paint (INP) — the latency of user interactions (target: under 200 ms). These metrics directly influence Google search ranking.

Loading optimizations address the time from navigation to first meaningful paint. Server-side rendering (see SSR Rendering Process) delivers pre-rendered HTML immediately. Code splitting (see Code Splitting Architecture) reduces initial JavaScript payload. Resource hints — , , dns-prefetch — instruct the browser to fetch critical resources early. Long Cache-Control max-age values with content-hashed filenames (see Browser Caching Strategy) eliminate repeat download costs.

Rendering optimizations target the time from JavaScript execution to usable UI. Lazy loading images and components (see Lazy Loading Components) defers non-critical work. Avoiding forced synchronous layout (interleaving DOM reads and writes) prevents the browser from flushing layout prematurely. Using transform and opacity for animations keeps them on the compositor thread, avoiding layout and paint work entirely.

Interaction optimizations keep INP low. Long tasks (> 50 ms) on the main thread block input processing; breaking them up with scheduler.yield() or setTimeout chunks keeps the browser responsive. Web Workers offload CPU-heavy computation to a background thread. Service workers (see Service Worker Lifecycle) handle network requests off the main thread. Together these strategies form a layered approach to frontend performance that compound each other's gains.

Free online editor
Edit this diagram in Graphlet
Fork, modify, and export to SVG or PNG. No sign-up required.
Open in Graphlet →

Frequently asked questions

Web performance optimization is the systematic process of identifying and resolving bottlenecks across loading, rendering, and interaction to improve user-perceived speed and Core Web Vitals scores — the three Google metrics (LCP, CLS, INP) that directly influence search ranking and user retention.
LCP measures how quickly the largest visible content element renders. Improve it by delivering pre-rendered HTML via SSR, preloading the hero image with `<link rel="preload">`, eliminating render-blocking scripts with `async`/`defer`, using a CDN to reduce TTFB, and compressing images with modern formats (WebP, AVIF). LCP should be under 2.5 seconds.
Use a Web Worker when you have a computation that takes more than ~50 ms — parsing large JSON, running image processing, executing cryptography, or sorting large data sets. Because Web Workers run on a background thread, they cannot block the main thread's event loop, keeping input handling and rendering smooth. They cannot access the DOM directly but can communicate with the main thread via `postMessage`.
The most impactful mistakes are: shipping unoptimised, unsplit JavaScript bundles that delay TTI (hurts INP), no explicit `width`/`height` on images causing layout shifts as they load (hurts CLS), not using SSR or preloading for the hero element (hurts LCP), and running long synchronous tasks on the main thread that delay input response (hurts INP). All are measurable in Chrome DevTools' Lighthouse and Performance panels.
LCP (Largest Contentful Paint) measures load speed — how fast the dominant visible element appears. CLS (Cumulative Layout Shift) measures visual stability — how much content unexpectedly shifts during load. INP (Interaction to Next Paint) measures responsiveness — the latency between a user interaction and the next frame painted in response. Each targets a distinct dimension of user experience: speed, stability, and interactivity.
mermaid
flowchart TD A[Identify Performance Bottleneck] --> B{Bottleneck category?} B --> C[Loading] B --> D[Rendering] B --> E[Interaction] C --> C1[Enable SSR or Static Generation] C --> C2[Code Split and Lazy Load JS] C --> C3[Preload Critical Resources] C --> C4[Set Long Cache-Control max-age] C --> C5[Compress Assets — Brotli or Gzip] D --> D1[Defer Non-Critical JS with async or defer] D --> D2[Lazy Load Images with loading=lazy] D --> D3[Use CSS transform and opacity for Animations] D --> D4[Avoid Forced Synchronous Layout] D --> D5[Minimize Render-Blocking CSS] E --> E1[Break Up Long Tasks on Main Thread] E --> E2[Offload CPU Work to Web Worker] E --> E3[Debounce High-Frequency Event Handlers] E --> E4[Virtualize Long Lists] C1 & C2 & C3 & C4 & C5 --> F[Measure LCP — Target under 2.5s] D1 & D2 & D3 & D4 & D5 --> G[Measure CLS — Target under 0.1] E1 & E2 & E3 & E4 --> H[Measure INP — Target under 200ms] F & G & H --> I[Core Web Vitals Pass] style I fill:#22c55e,color:#fff
Copied to clipboard