IoT Telemetry Pipeline
An IoT telemetry pipeline is the cloud-side infrastructure that receives high-throughput sensor messages from connected devices, routes them through stream processing and storage layers, and delivers outputs to dashboards, alert systems, and downstream analytics consumers.
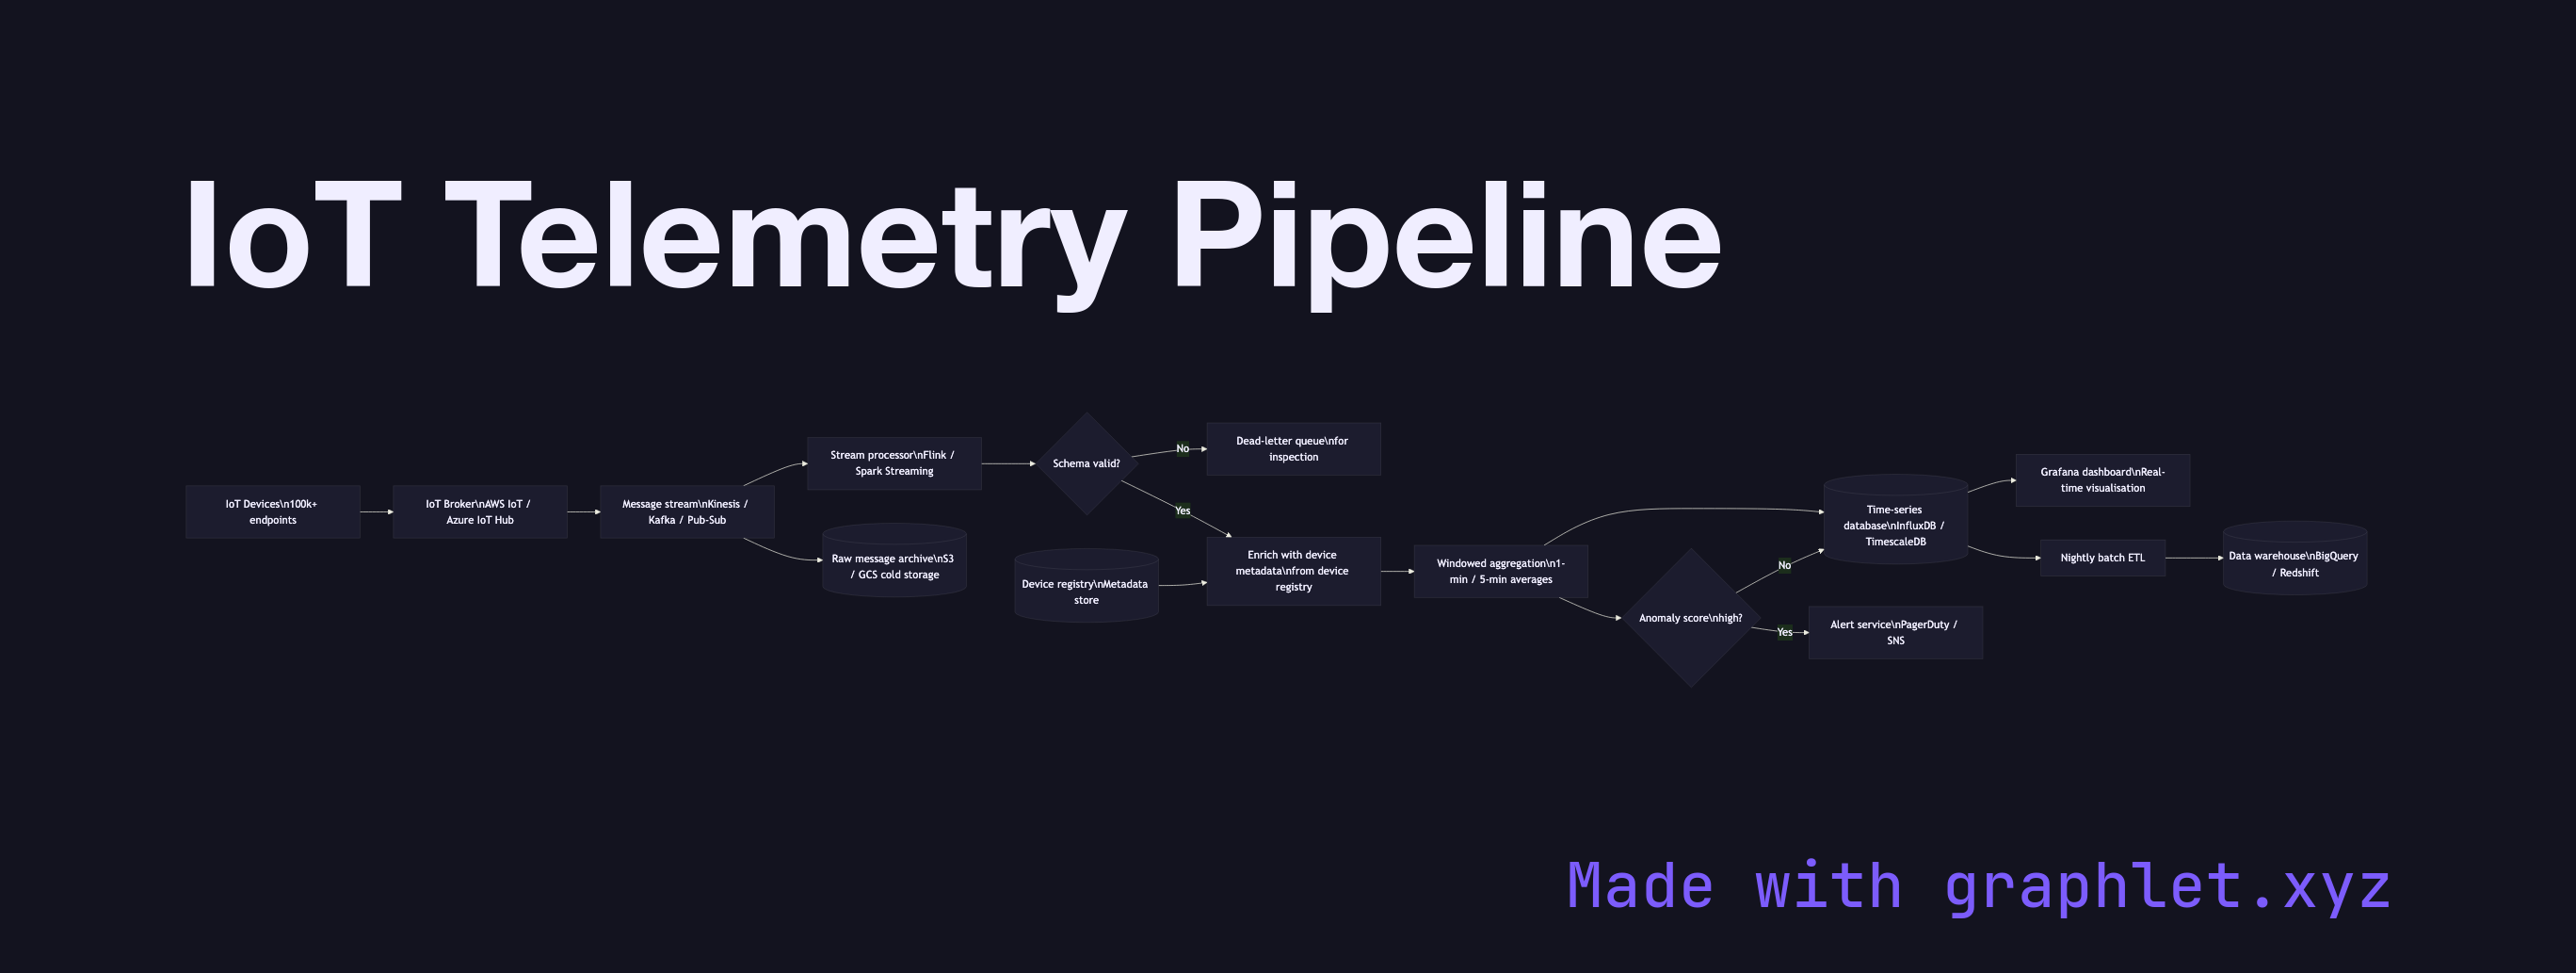
An IoT telemetry pipeline is the cloud-side infrastructure that receives high-throughput sensor messages from connected devices, routes them through stream processing and storage layers, and delivers outputs to dashboards, alert systems, and downstream analytics consumers.
Telemetry pipelines must handle scale and heterogeneity simultaneously. A deployment with 100,000 devices each sending one message per second produces 100,000 inbound messages per second. Messages vary in schema by device type and firmware version. The pipeline must be elastic, schema-tolerant, and able to maintain low end-to-end latency (typically < 5 seconds from device to dashboard).
The ingestion tier is a managed IoT broker (AWS IoT Core, Azure IoT Hub) or a self-hosted MQTT cluster that accepts authenticated device connections. The broker fans messages into a message stream — Kinesis, Kafka, or Pub/Sub — which provides durability, replay capability, and backpressure isolation between producers and consumers.
Stream processors (Apache Flink, Spark Streaming, or cloud-native equivalents) consume from the stream in real time. They perform: schema validation and normalisation, device-level enrichment (looking up metadata from a device registry), windowed aggregation (computing 1-minute averages), and anomaly scoring. Valid records are written to a time-series database (InfluxDB, TimescaleDB, or cloud equivalents). Records flagged as anomalous route to an alerting service that evaluates severity rules and dispatches notifications.
Periodically, a batch ETL job reads the time-series store and writes rolled-up data into a data warehouse for long-term analytics. A metadata store (device registry, site hierarchy, equipment catalogue) is queried both by stream processors and dashboards to enrich raw telemetry with business context. For the upstream pipeline feeding this architecture, see IoT Sensor Data Pipeline. For aggregation patterns on the stored data, see IoT Data Aggregation. For event streaming architecture at the messaging layer, see messaging/event-streaming-architecture.