IoT Sensor Data Pipeline
An IoT sensor data pipeline describes the sequential stages that transform raw physical measurements into clean, structured records ready for storage, analysis, and alerting — handling everything from initial sampling and noise filtering through protocol encoding and cloud ingestion.
An IoT sensor data pipeline describes the sequential stages that transform raw physical measurements into clean, structured records ready for storage, analysis, and alerting — handling everything from initial sampling and noise filtering through protocol encoding and cloud ingestion.
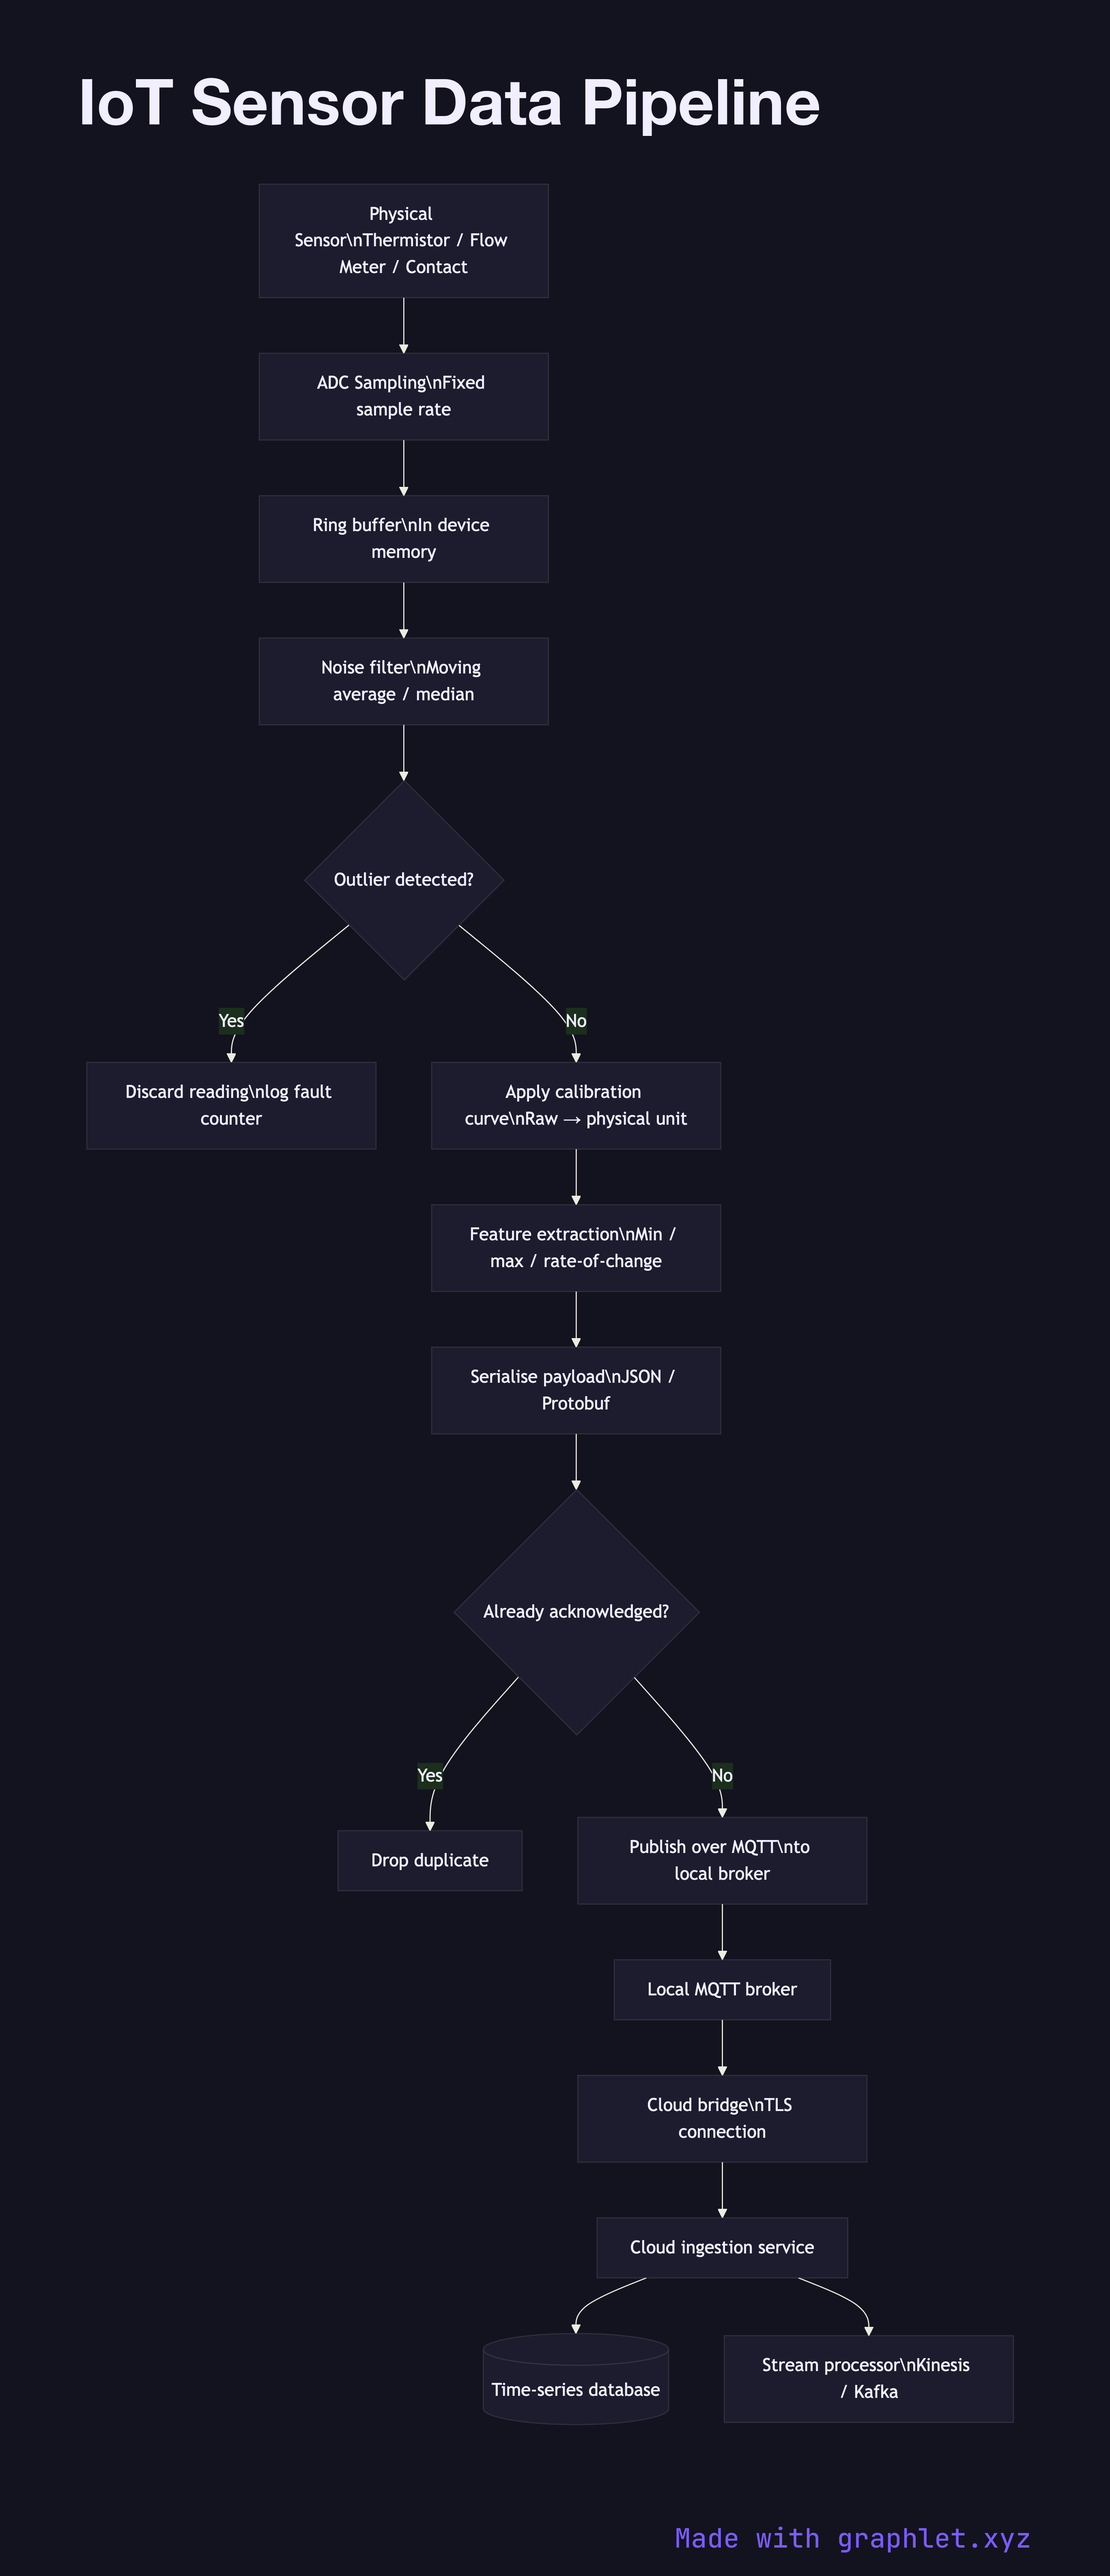
Sensors produce a continuous stream of raw electrical signals — voltages from a thermistor, pulse counts from a flow meter, or binary state changes from a contact switch. The first pipeline stage is sampling: the microcontroller's ADC reads the signal at a fixed rate (e.g., 10 Hz) and buffers the values in memory. Buffering is essential because downstream processing steps are slower than raw acquisition.
The preprocessing stage cleans the buffered readings. A moving-average or median filter removes transient noise spikes. Outlier rejection discards readings that deviate by more than N standard deviations from the local mean — a symptom of EMI interference or sensor fault. Calibration then maps the cleaned value through a linearisation curve to produce a physical unit (°C, Pa, m/s).
Cleaned readings enter a feature extraction stage, where derived values are computed: min/max over a sliding window, rate of change, or a fast Fourier transform magnitude for vibration analysis. These features are far more useful to downstream consumers than raw samples, and they compress the data volume significantly.
The extracted features are serialised — typically as JSON, MessagePack, or a binary Protobuf — and published over MQTT to a local broker or directly to a cloud endpoint. A deduplication check prevents re-sending messages that were acknowledged in a previous attempt. The cloud ingestion service writes confirmed messages to a time-series database and enqueues them for stream processing. For the full device-to-cloud journey, see IoT Device Data Flow. For edge-side computation in more depth, see IoT Edge Processing. For downstream aggregation of ingested data, see IoT Data Aggregation.