diagram.mmd — flowchart
IoT Data Aggregation flowchart diagram

IoT data aggregation is the process of combining high-frequency raw sensor readings into progressively coarser time-series rollups — minute averages, hourly summaries, daily statistics — enabling efficient long-term storage, fast query performance, and meaningful trend analysis without retaining every individual sample indefinitely.

Raw IoT telemetry is expensive to store and slow to query at scale. A sensor reporting at 1 Hz generates 86,400 readings per day per device. A fleet of 10,000 devices produces 864 million raw records daily. Querying "average temperature last month by building" across this volume would be prohibitively slow without pre-aggregated rollup tables.

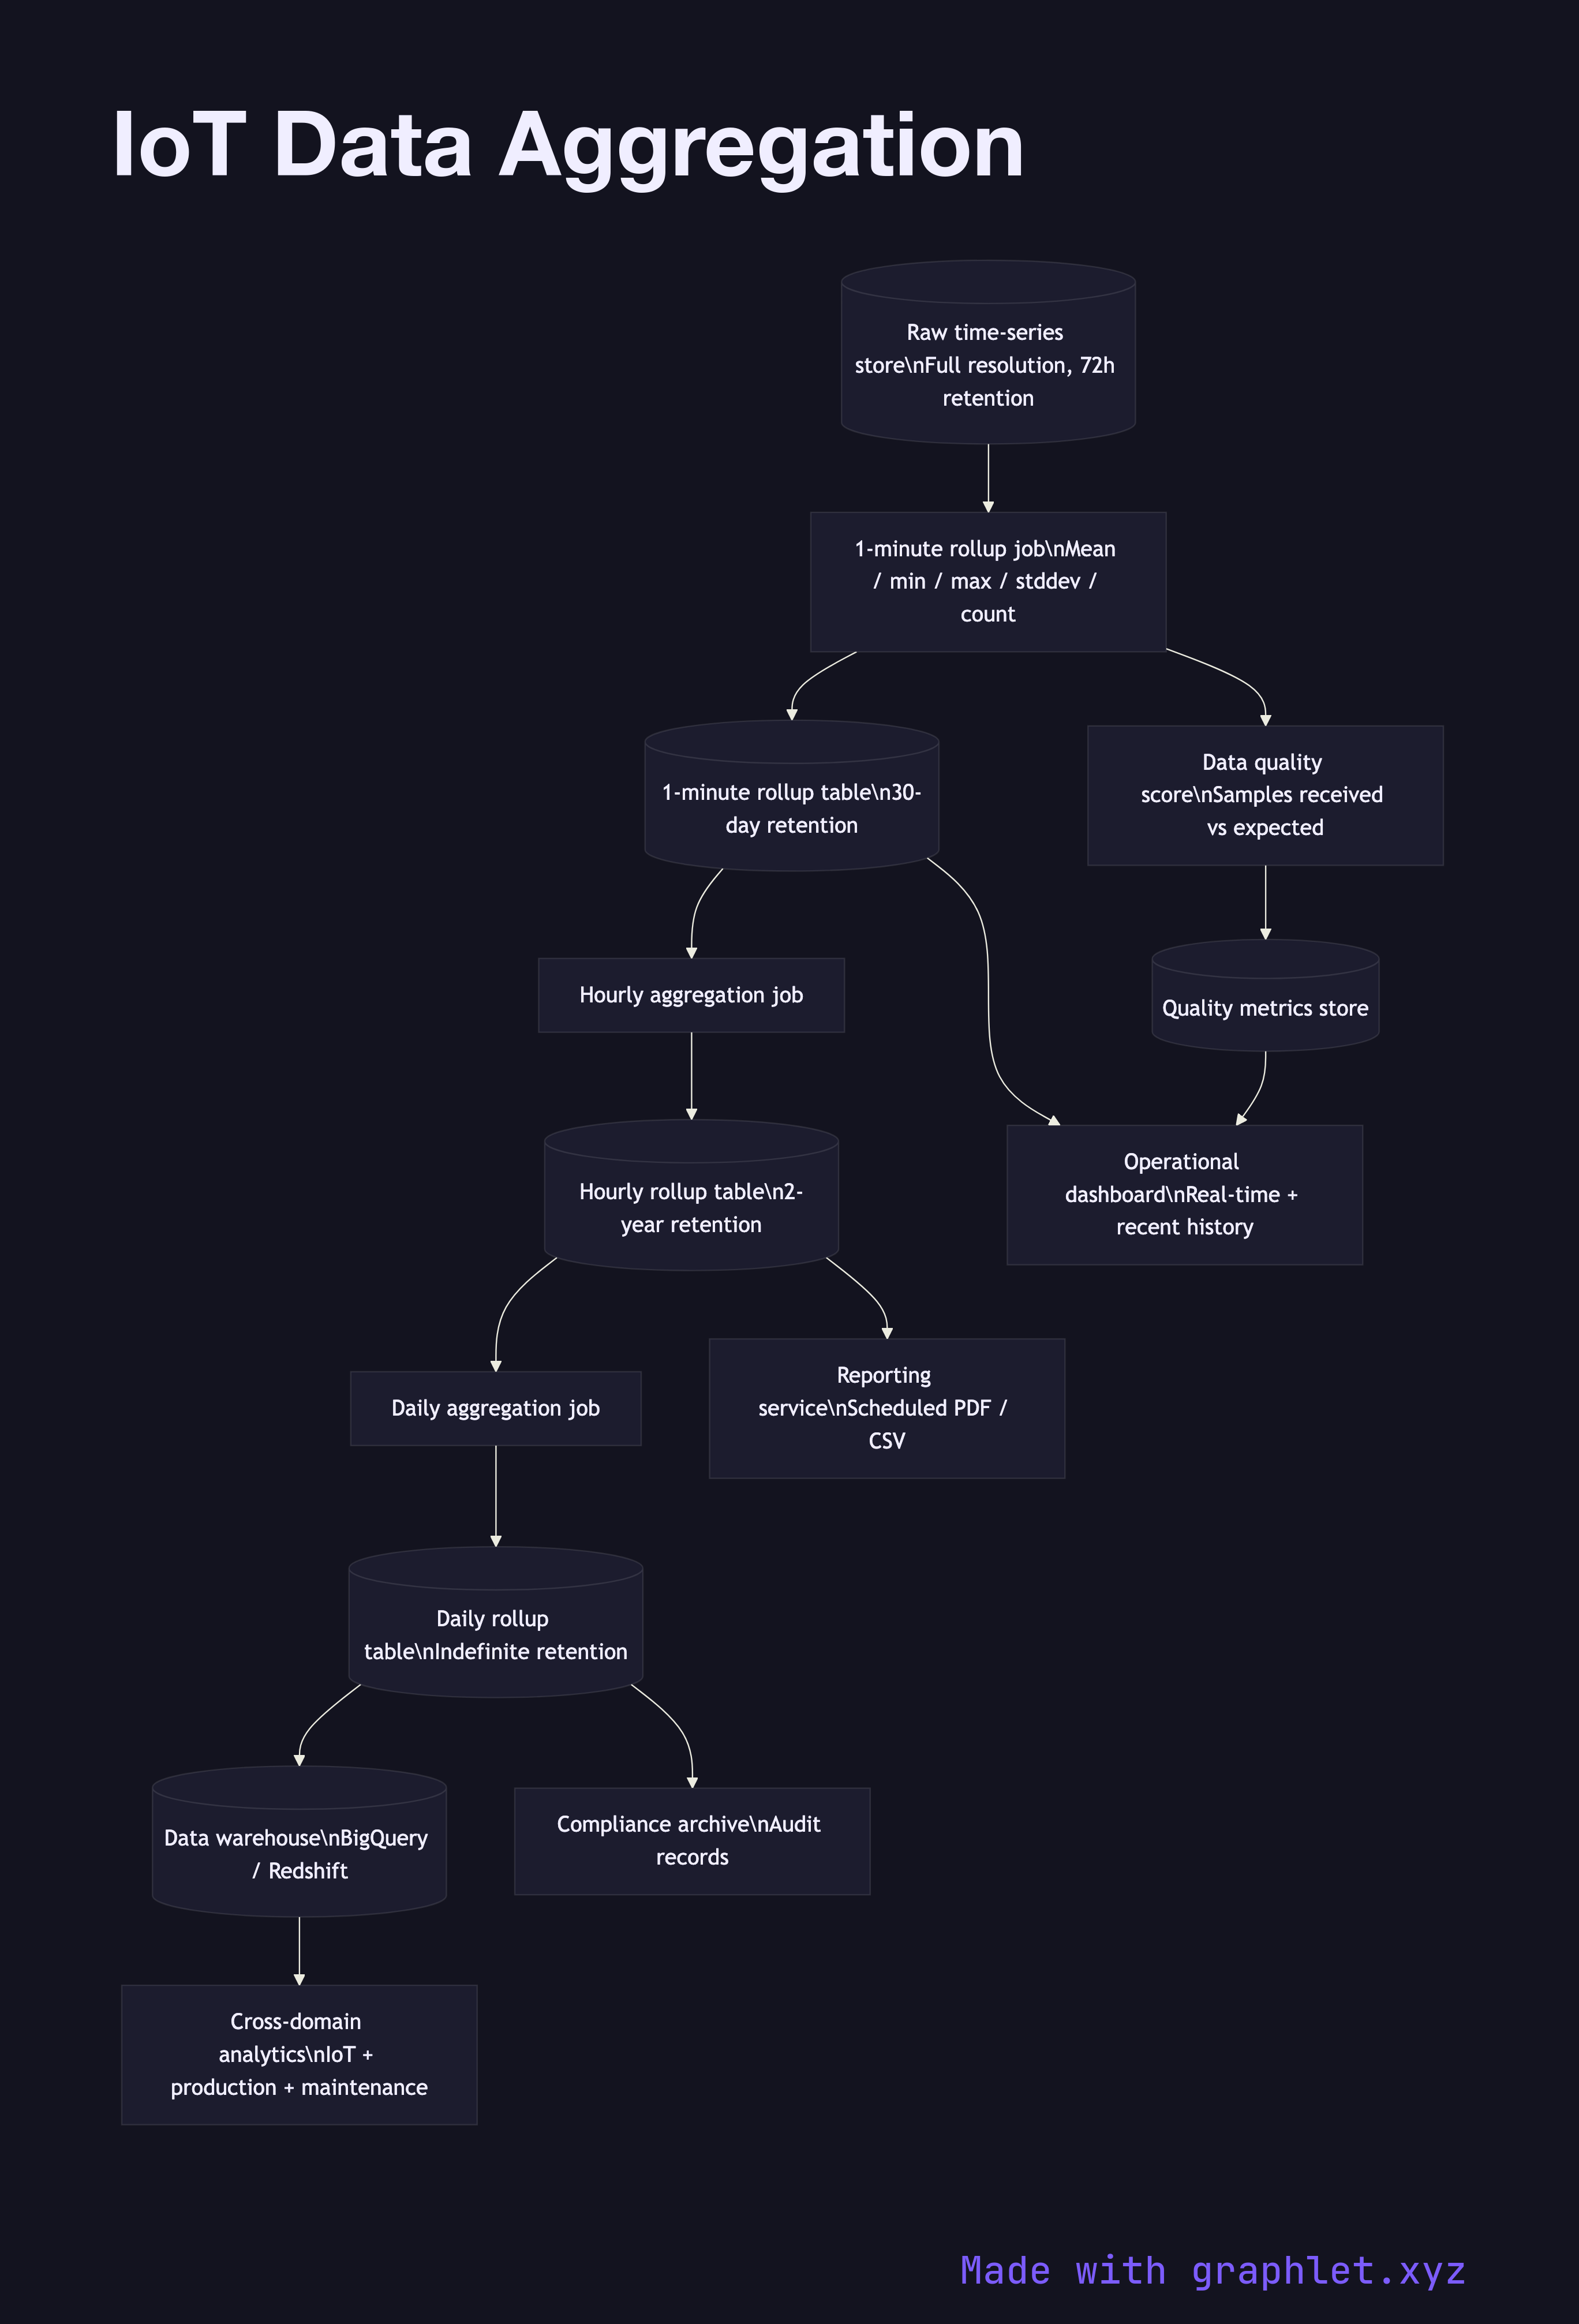
The aggregation pipeline begins with the raw time-series store, which holds full-resolution data for a short retention window (typically 24–72 hours). A 1-minute rollup job runs continuously, reading each device's raw samples in the most recent complete minute window and computing: mean, min, max, standard deviation, and sample count. These rollup records are written to a 1-minute rollup table with a longer retention (30–90 days).

Downstream, an hourly aggregation job reads from the 1-minute rollups (not the raw table) and computes hourly statistics with even longer retention (1–2 years). A daily aggregation job does the same from hourly rollups and is retained indefinitely for compliance and long-term trend analysis. Each rollup tier also computes a data quality score — the ratio of expected samples to received samples — flagging gaps caused by device downtime or connectivity issues.

The aggregated data serves multiple consumers: operational dashboards displaying real-time and recent-history charts, reporting services generating scheduled PDF or CSV reports, and a data warehouse that combines IoT metrics with business data (production records, maintenance logs) for cross-domain analysis. For the upstream ingestion feeding this pipeline, see IoT Telemetry Pipeline. For the broader device-to-cloud flow, see IoT Device Data Flow. For the sensor-level pipeline that produces the raw data, see IoT Sensor Data Pipeline.

Free online editor
Edit this diagram in Graphlet
Fork, modify, and export to SVG or PNG. No sign-up required.
Open in Graphlet →

Frequently asked questions

IoT data aggregation is the process of combining high-frequency raw sensor readings into progressively coarser time-series rollups — minute averages, hourly summaries, daily statistics — to enable efficient long-term storage, fast query performance, and trend analysis without retaining every individual sample indefinitely.
A raw time-series store holds full-resolution data for a short retention window. Rollup jobs read completed time windows and compute mean, min, max, standard deviation, and sample count at progressively coarser granularities. Each tier reads from the previous tier rather than the raw store. A data quality score is computed at each rollup, flagging gaps caused by device downtime. Aggregated data is served to dashboards, reporting services, and a data warehouse.
Use rollup tiers when raw data volume makes direct querying prohibitively slow or expensive, when dashboards need to display trends over days, months, or years, or when storage costs must be controlled by retiring high-resolution data after a short window. A single tier is sufficient for small deployments; large fleets typically benefit from three or more tiers (minute, hourly, daily) with different retention policies.
Common mistakes include running rollup jobs against the raw store at scale rather than chaining tiers, which creates query contention during peak ingestion. Others are not computing data quality scores so gaps in device uptime are invisible to analysts, using wall-clock time windows that drift across time zones rather than UTC-aligned windows, and retaining too many raw samples indefinitely because no retention policy was set during initial design.
mermaid
flowchart TD Raw[(Raw time-series store\nFull resolution, 72h retention)] --> OneMin[1-minute rollup job\nMean / min / max / stddev / count] OneMin --> OneMinTable[(1-minute rollup table\n30-day retention)] OneMinTable --> Hourly[Hourly aggregation job] Hourly --> HourlyTable[(Hourly rollup table\n2-year retention)] HourlyTable --> Daily[Daily aggregation job] Daily --> DailyTable[(Daily rollup table\nIndefinite retention)] OneMin --> Quality[Data quality score\nSamples received vs expected] Quality --> QualityStore[(Quality metrics store)] OneMinTable --> OpsDash[Operational dashboard\nReal-time + recent history] HourlyTable --> ReportSvc[Reporting service\nScheduled PDF / CSV] DailyTable --> Warehouse[(Data warehouse\nBigQuery / Redshift)] Warehouse --> BizAnalytics[Cross-domain analytics\nIoT + production + maintenance] QualityStore --> OpsDash DailyTable --> Compliance[Compliance archive\nAudit records]
Copied to clipboard