Internet of Things systems connect physical sensors and actuators to cloud platforms through layered architectures that handle collection, filtering, transmission, and analysis of real-world data. Designing these pipelines reliably requires understanding each stage — from the edge device that reads a temperature sensor to the cloud service that triggers an alert when a threshold is breached.
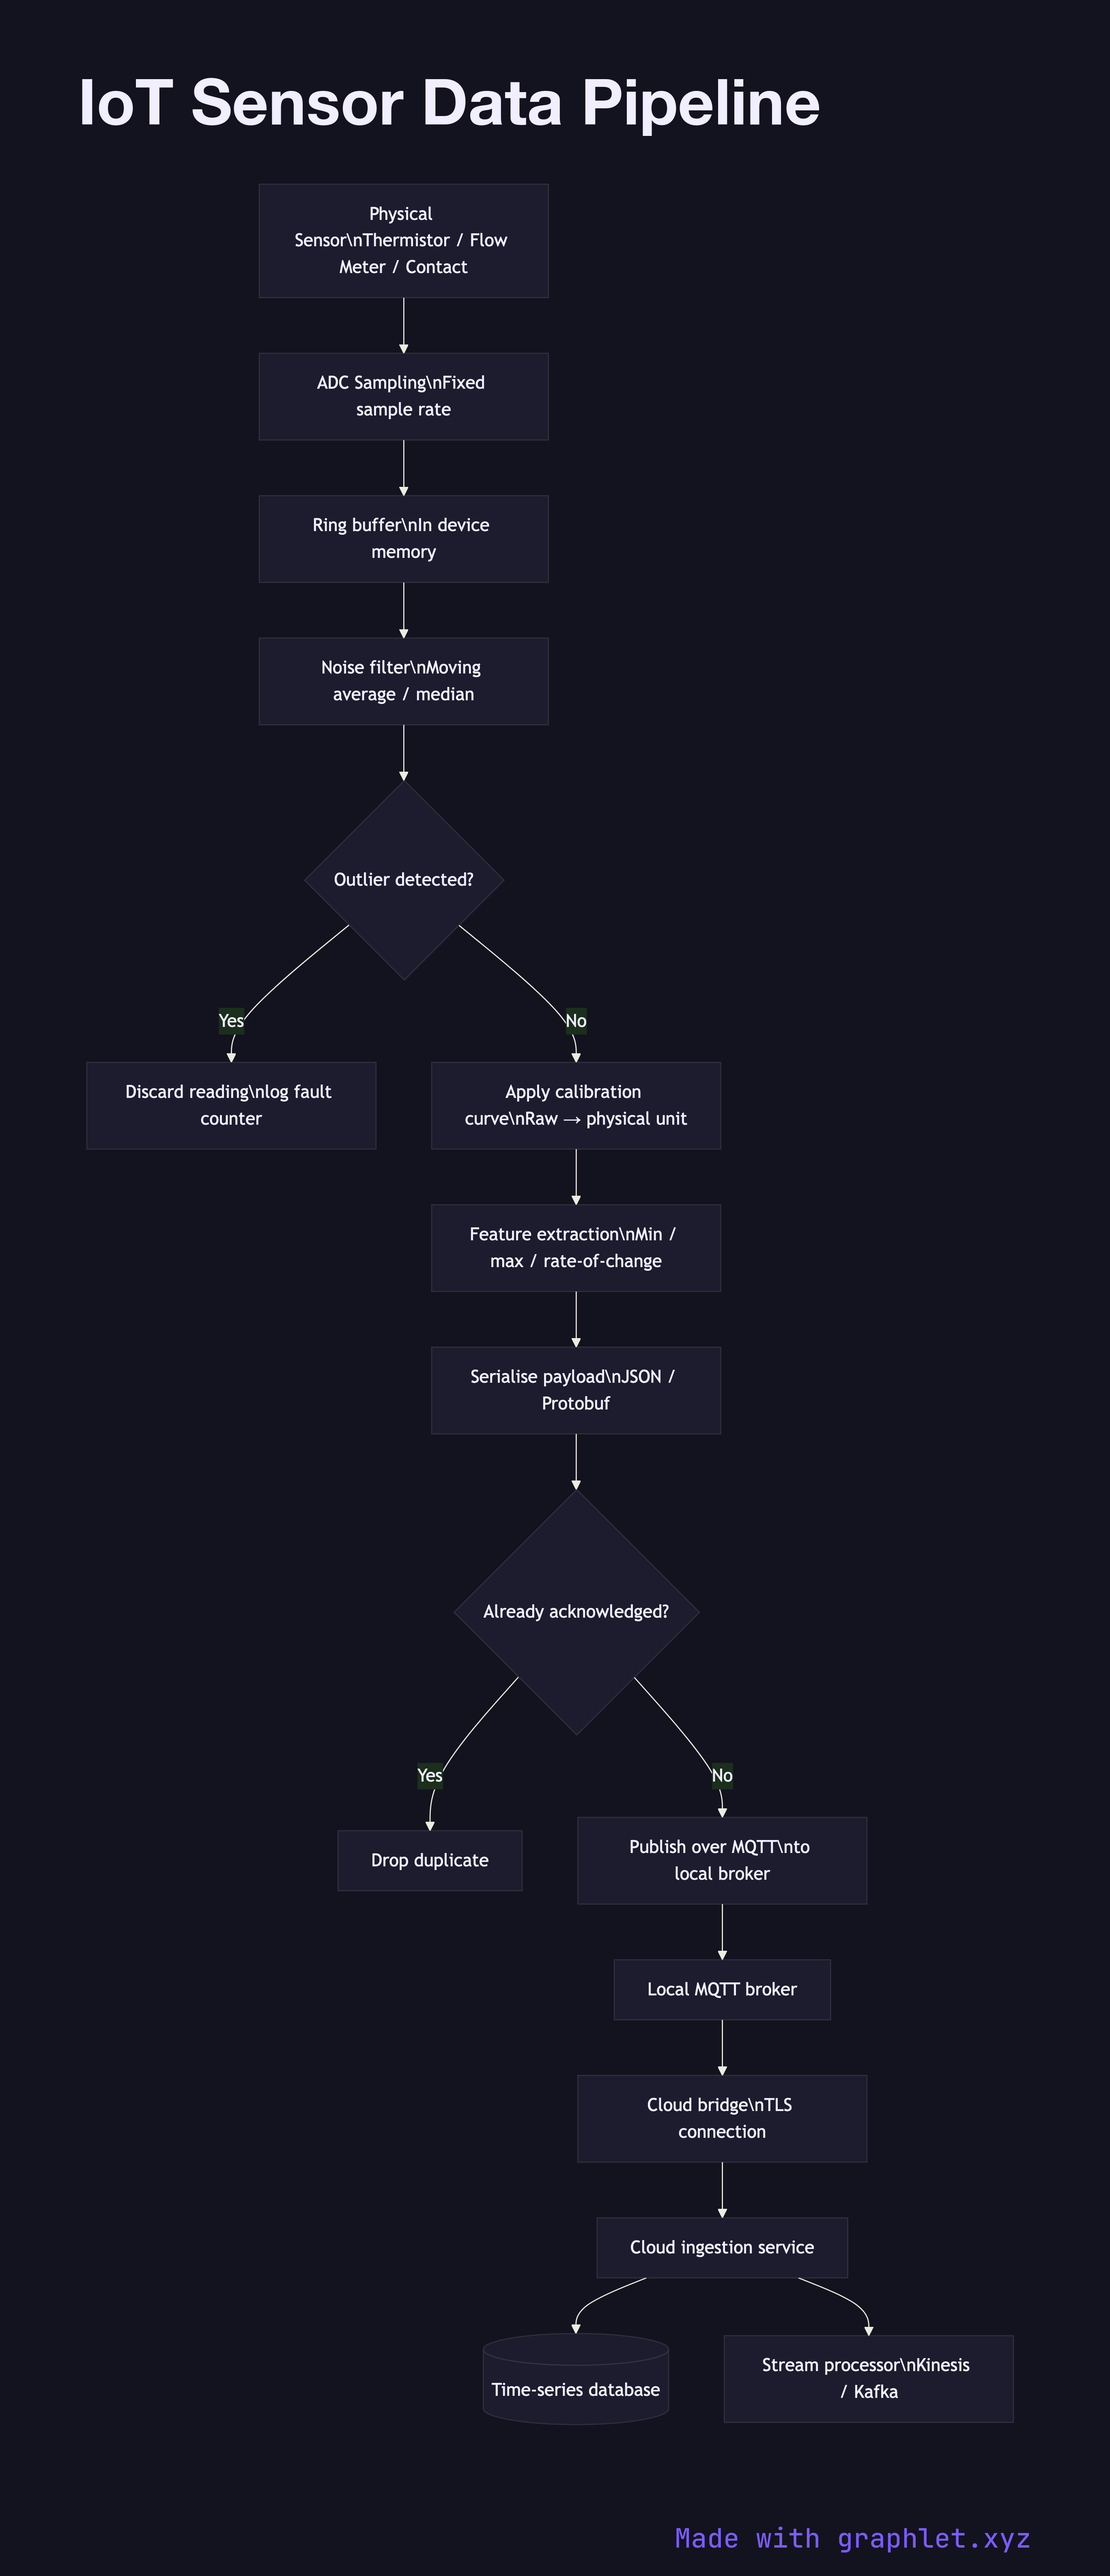
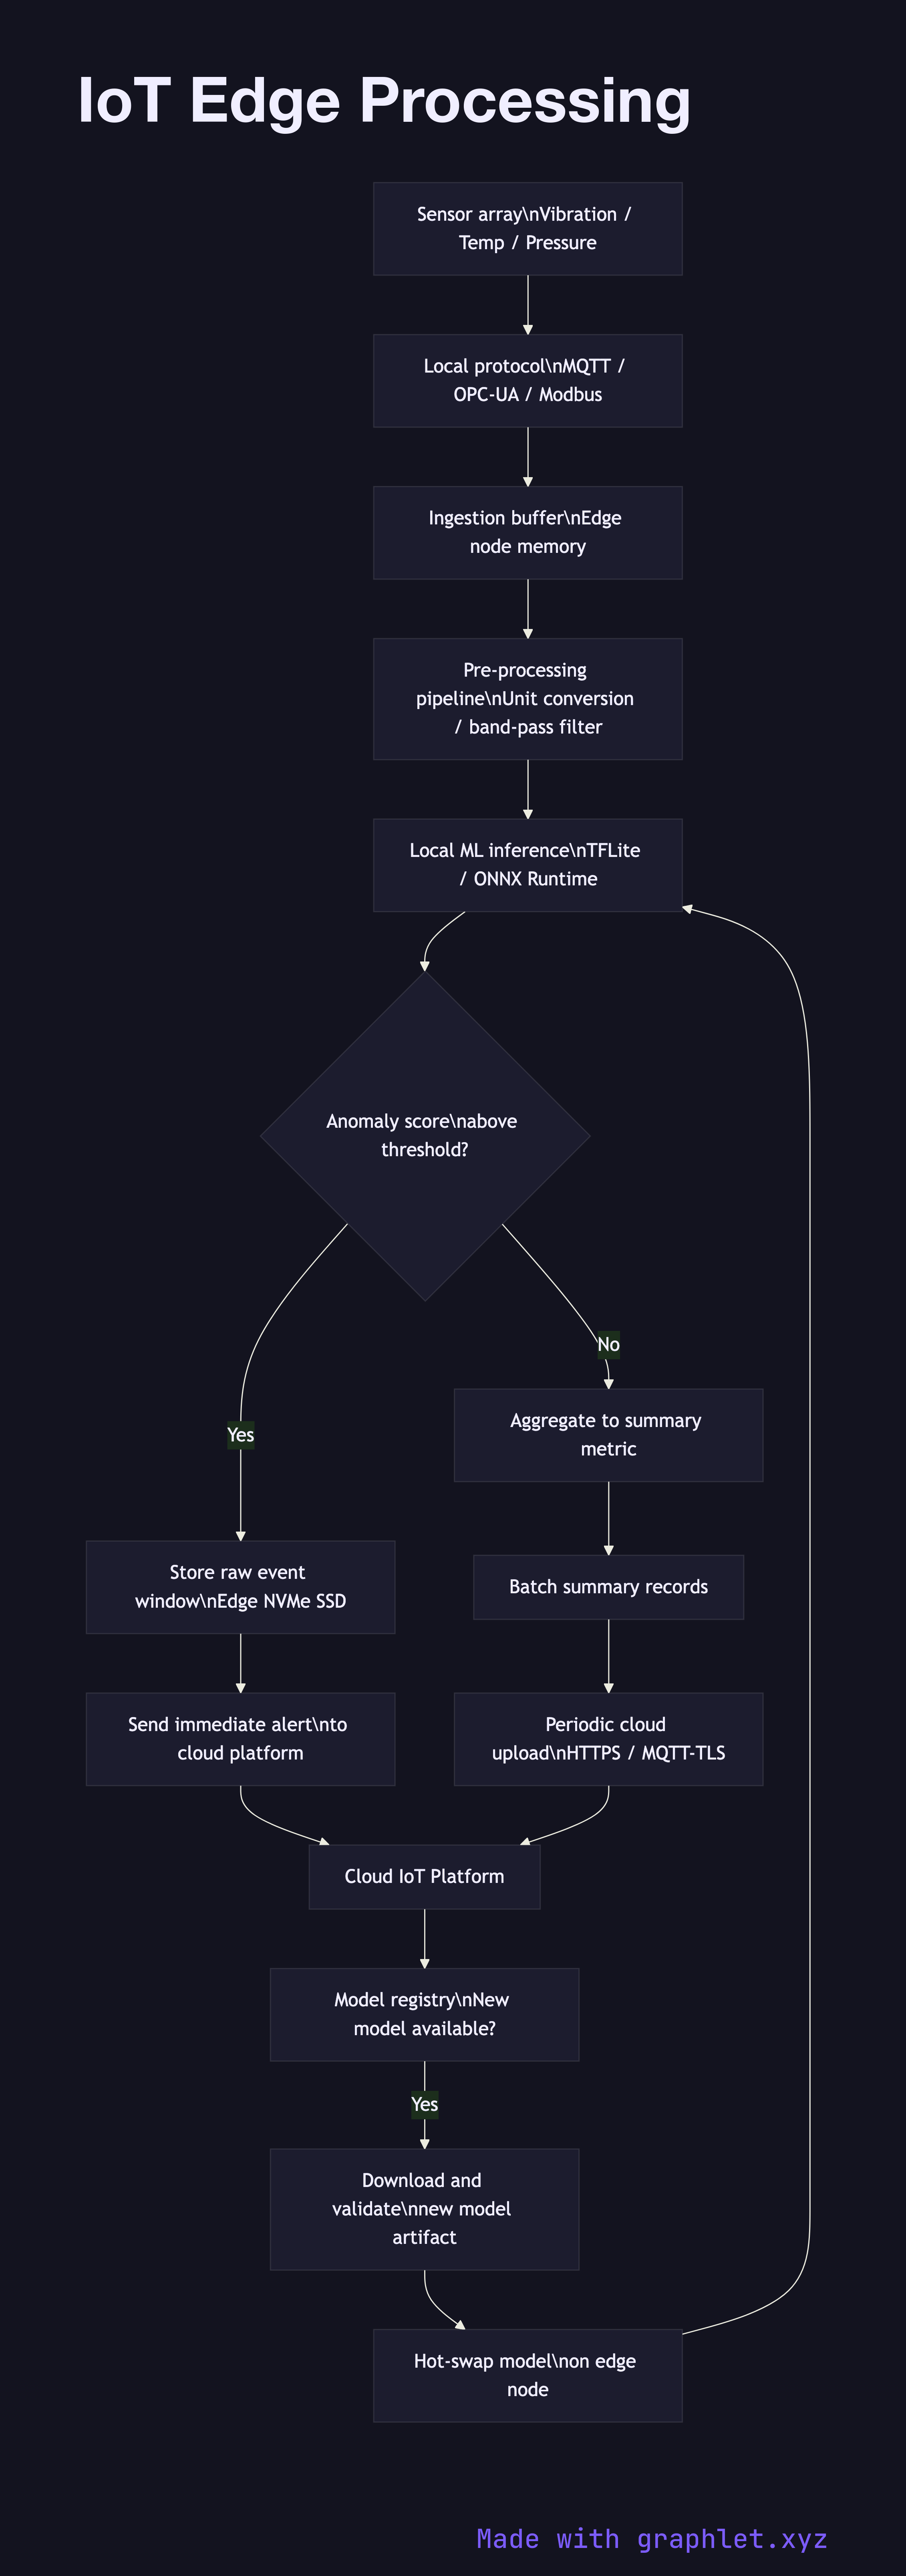
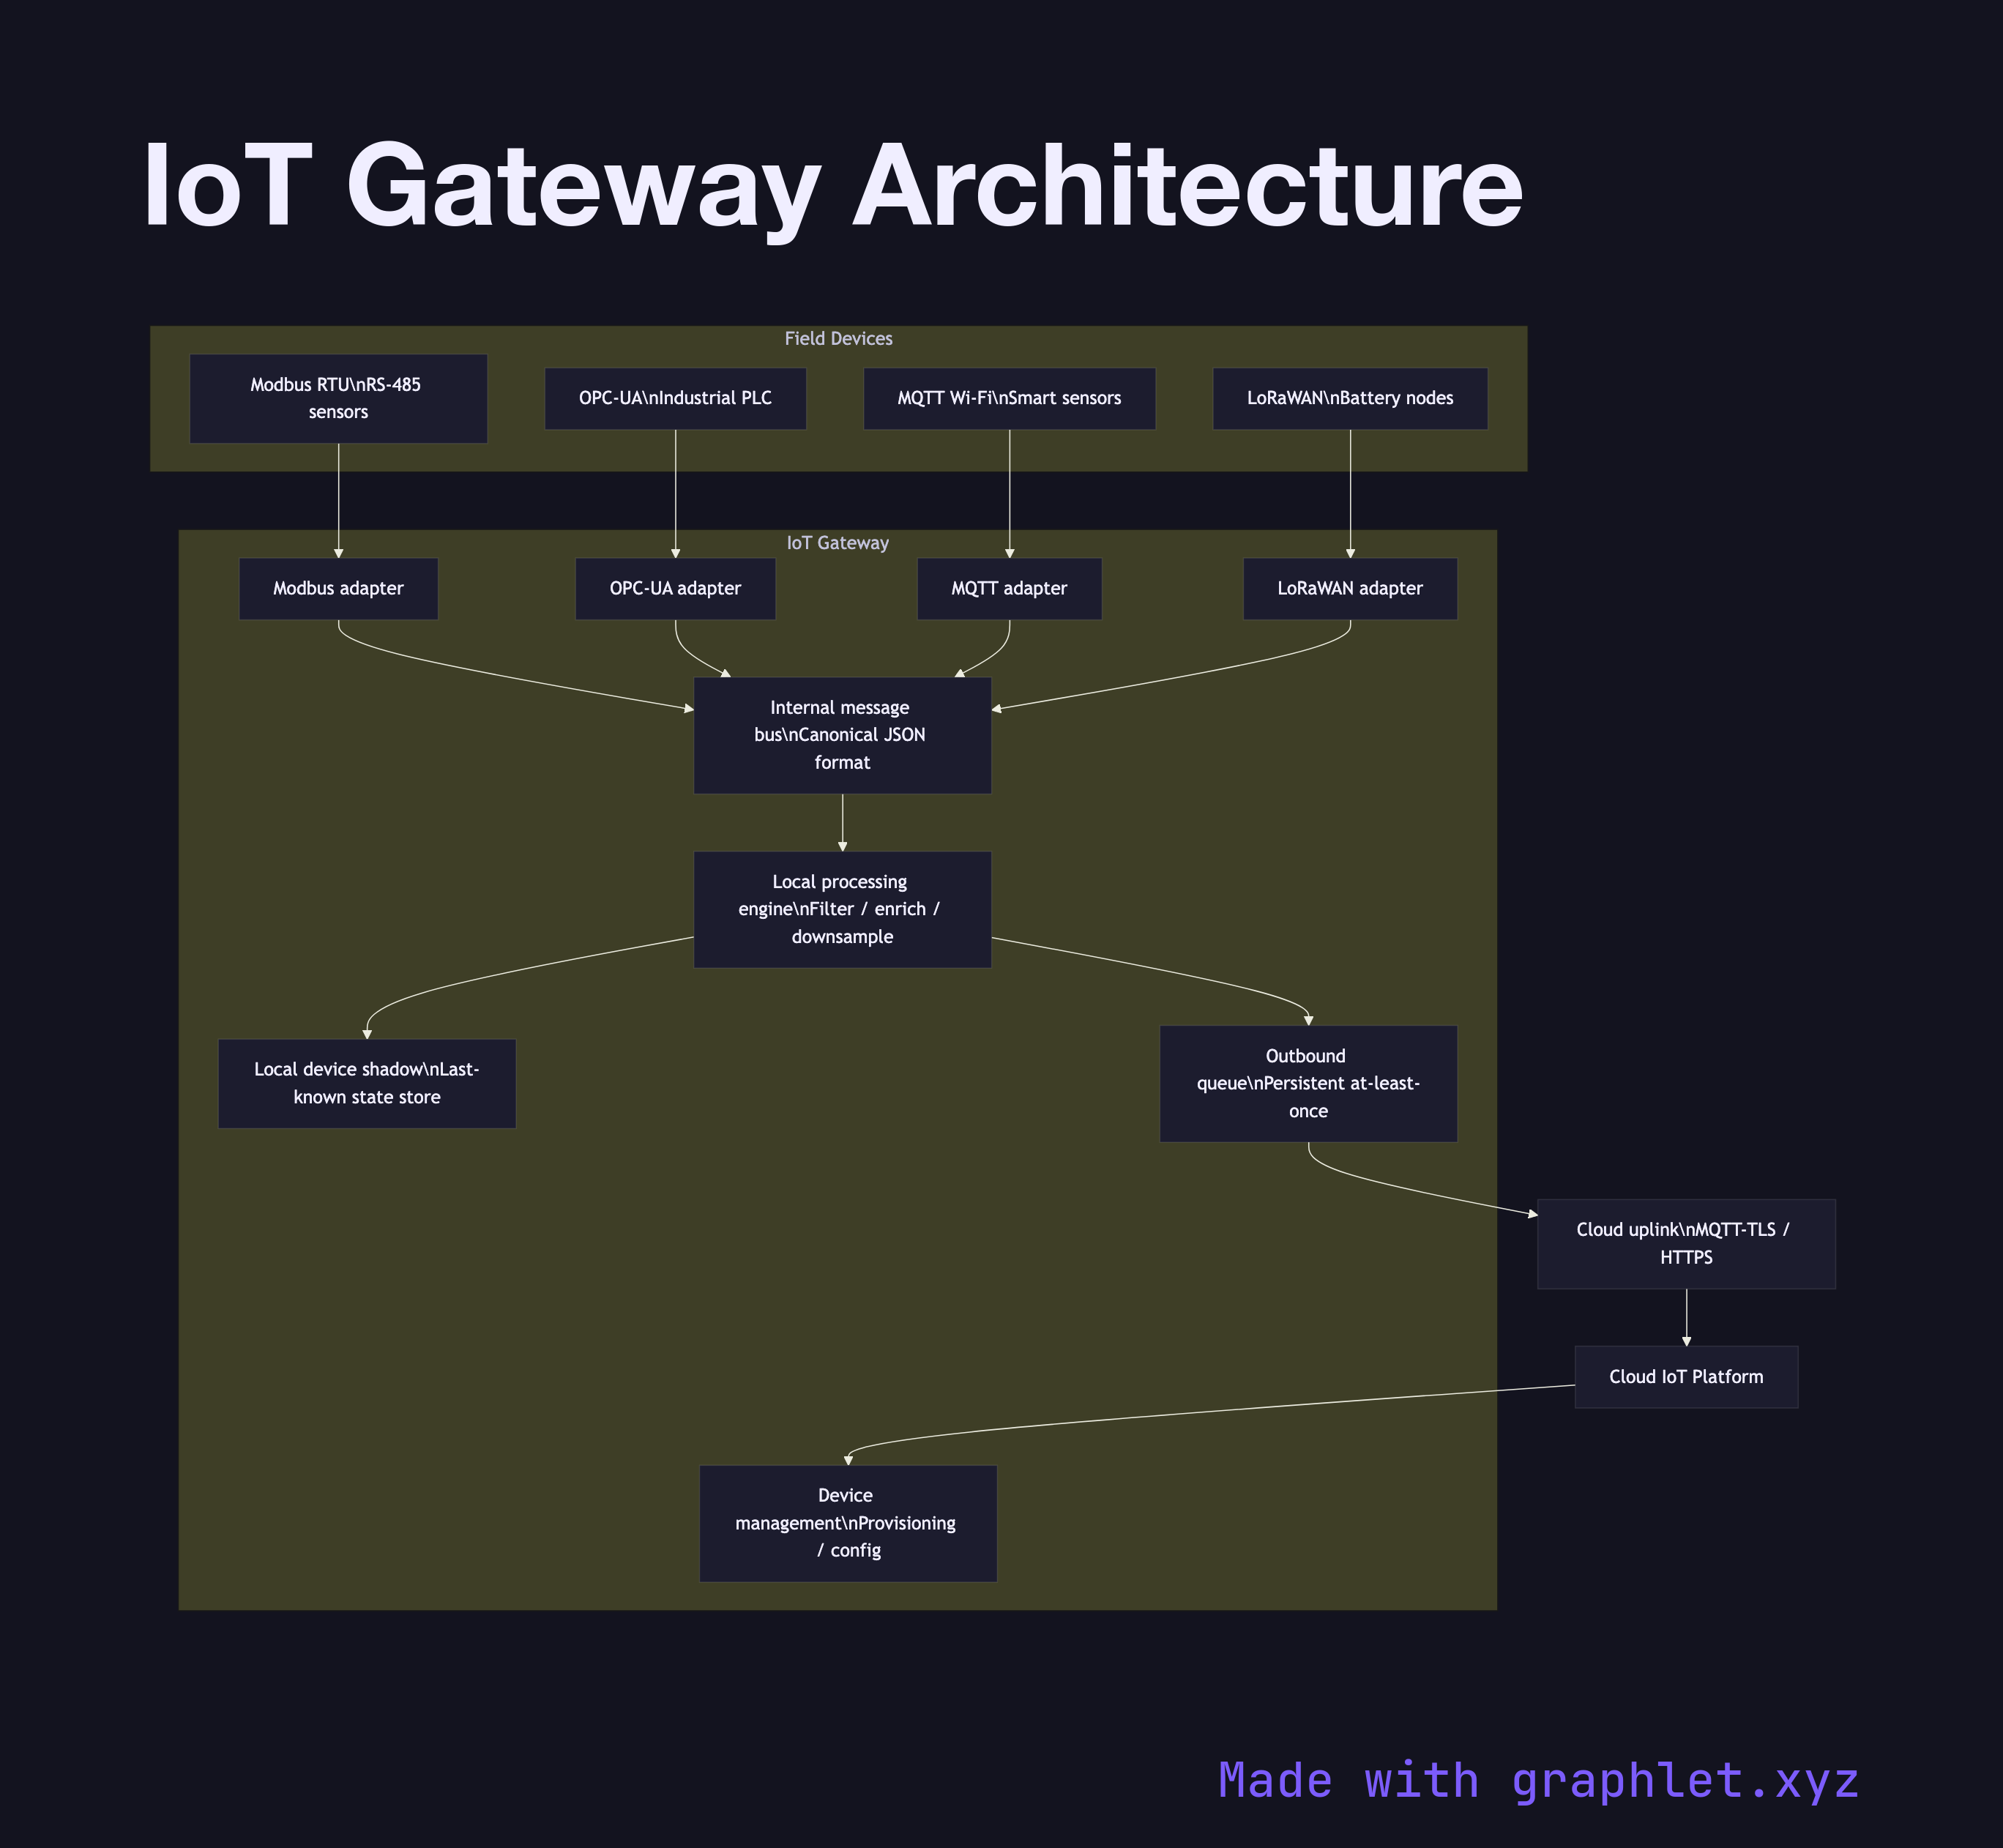
This collection covers the core patterns IoT and embedded developers encounter in production systems. IoT Device Data Flow traces the full journey from raw sensor reading to analytics dashboard. IoT Sensor Data Pipeline focuses on ingestion and preprocessing, while IoT Edge Processing details local filtering and inference before data leaves the device. IoT Gateway Architecture shows how protocol translation and fan-out are handled at the network boundary.
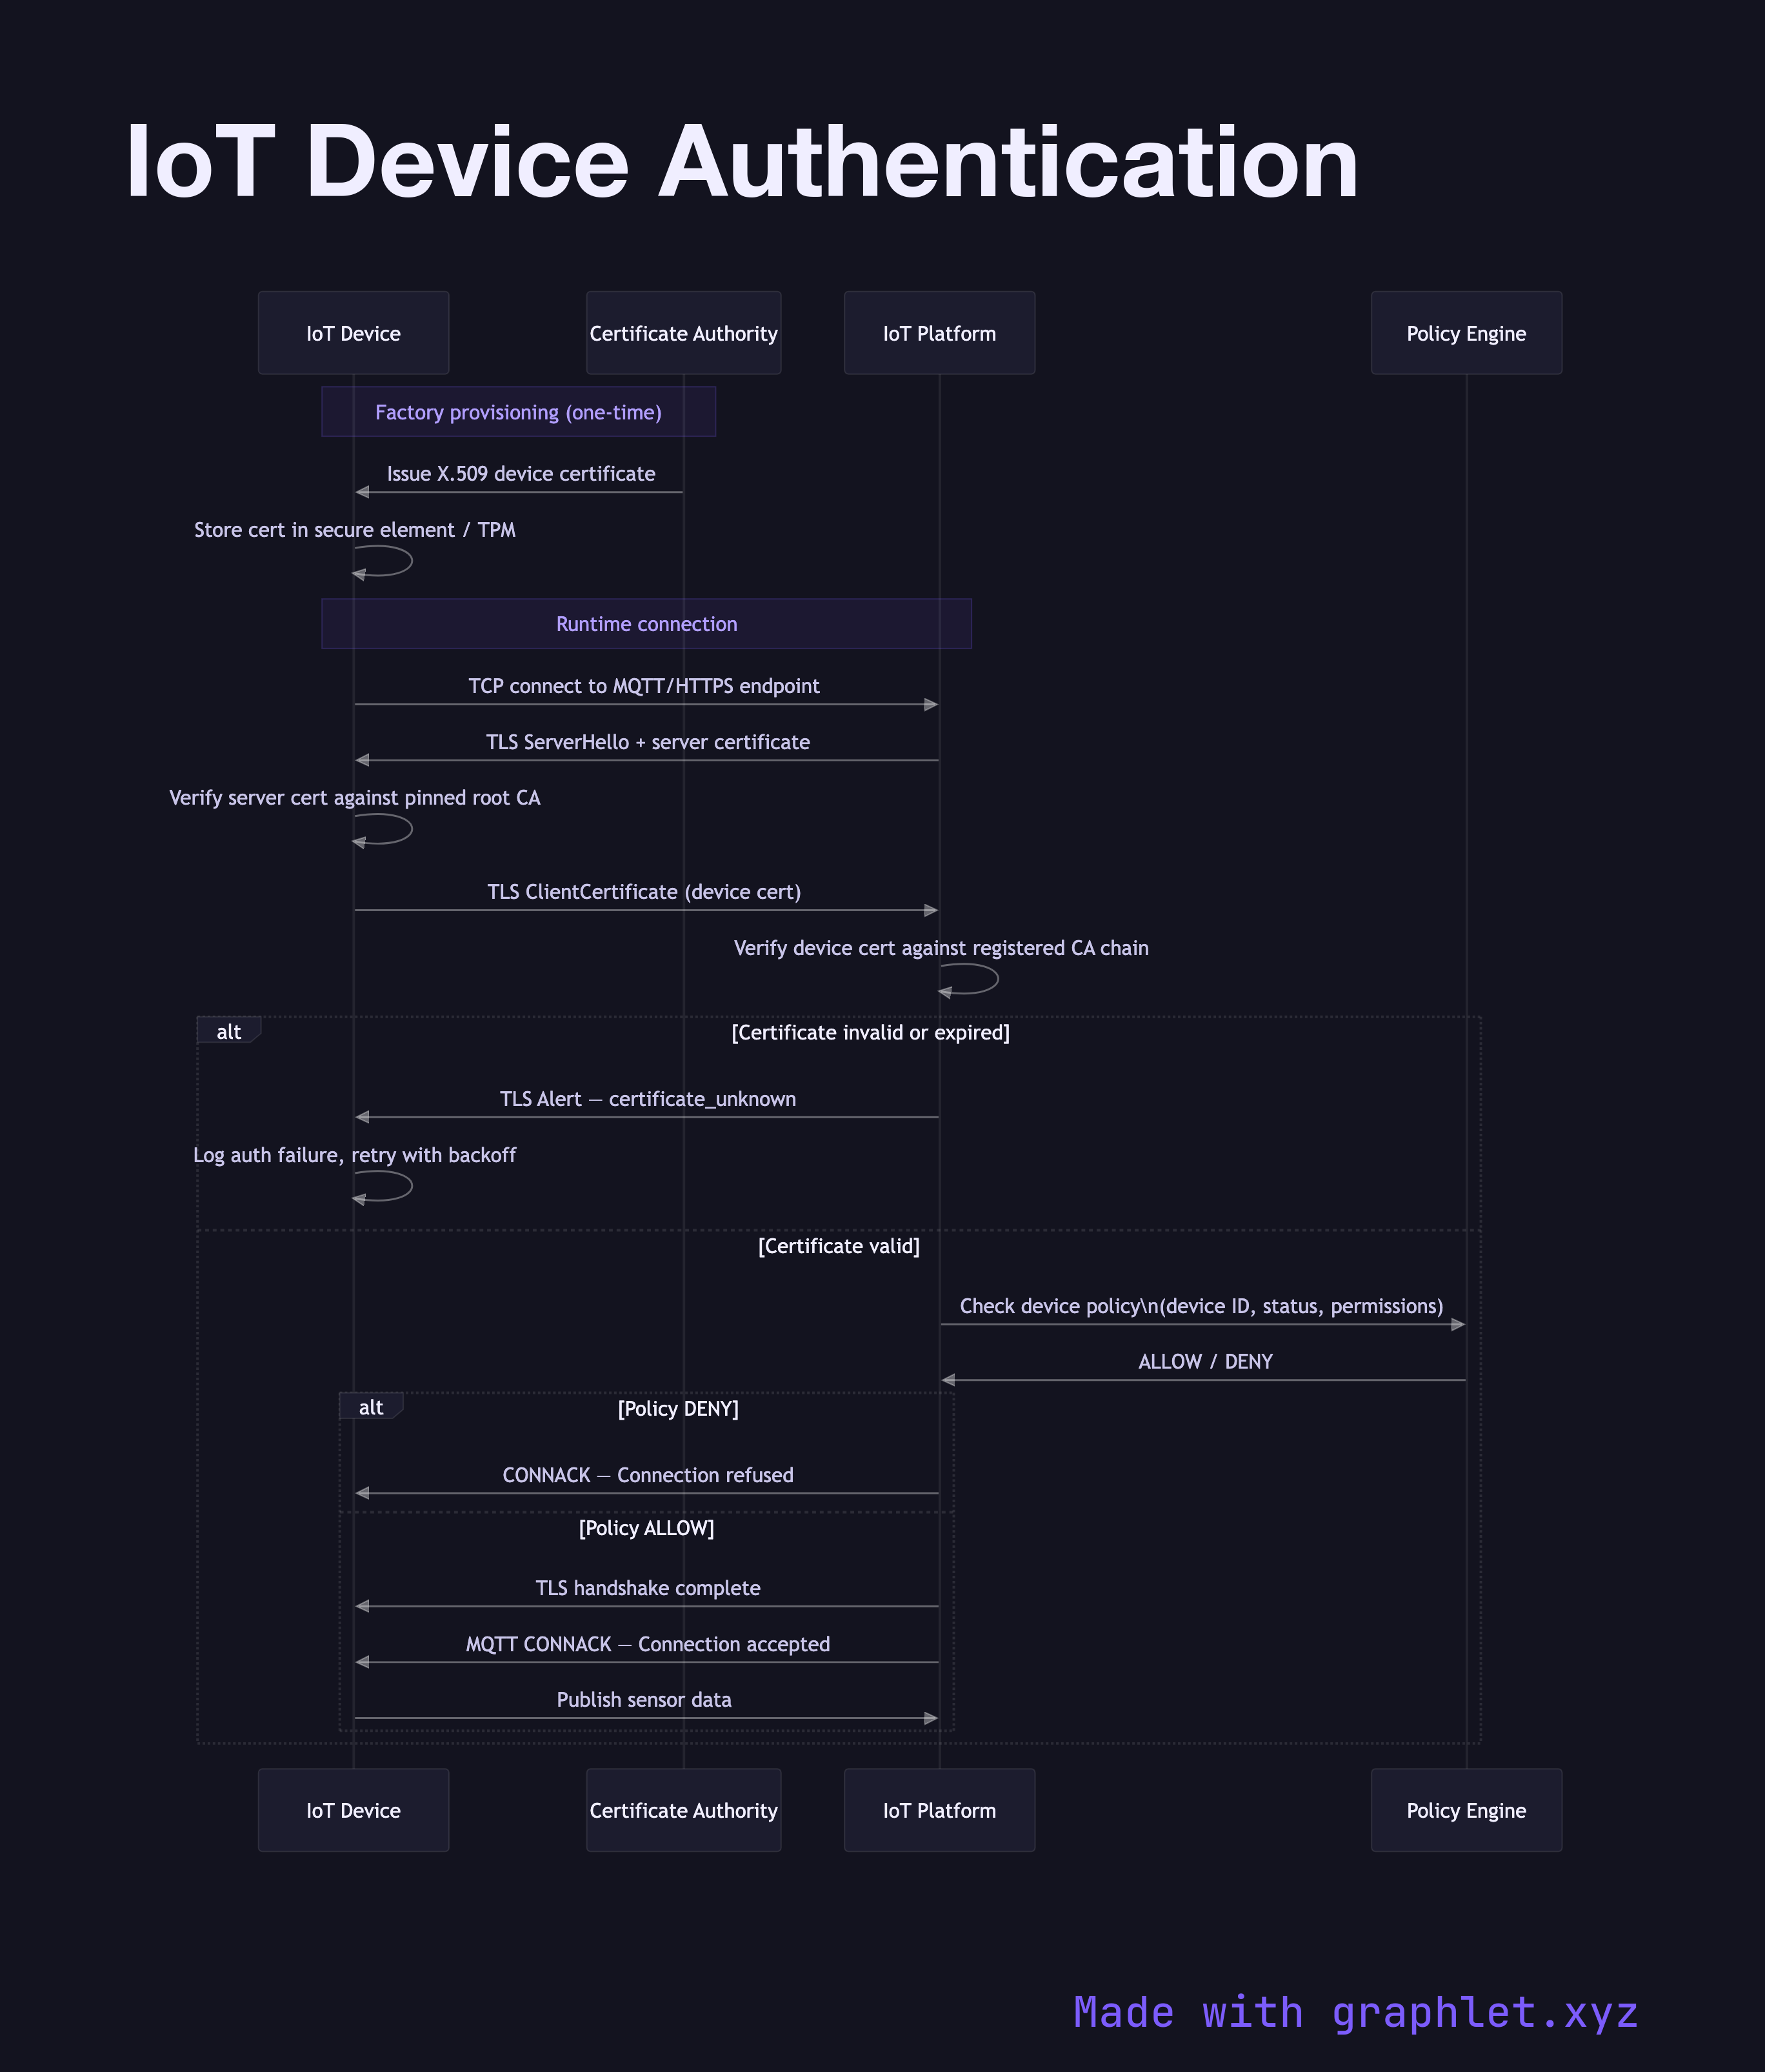
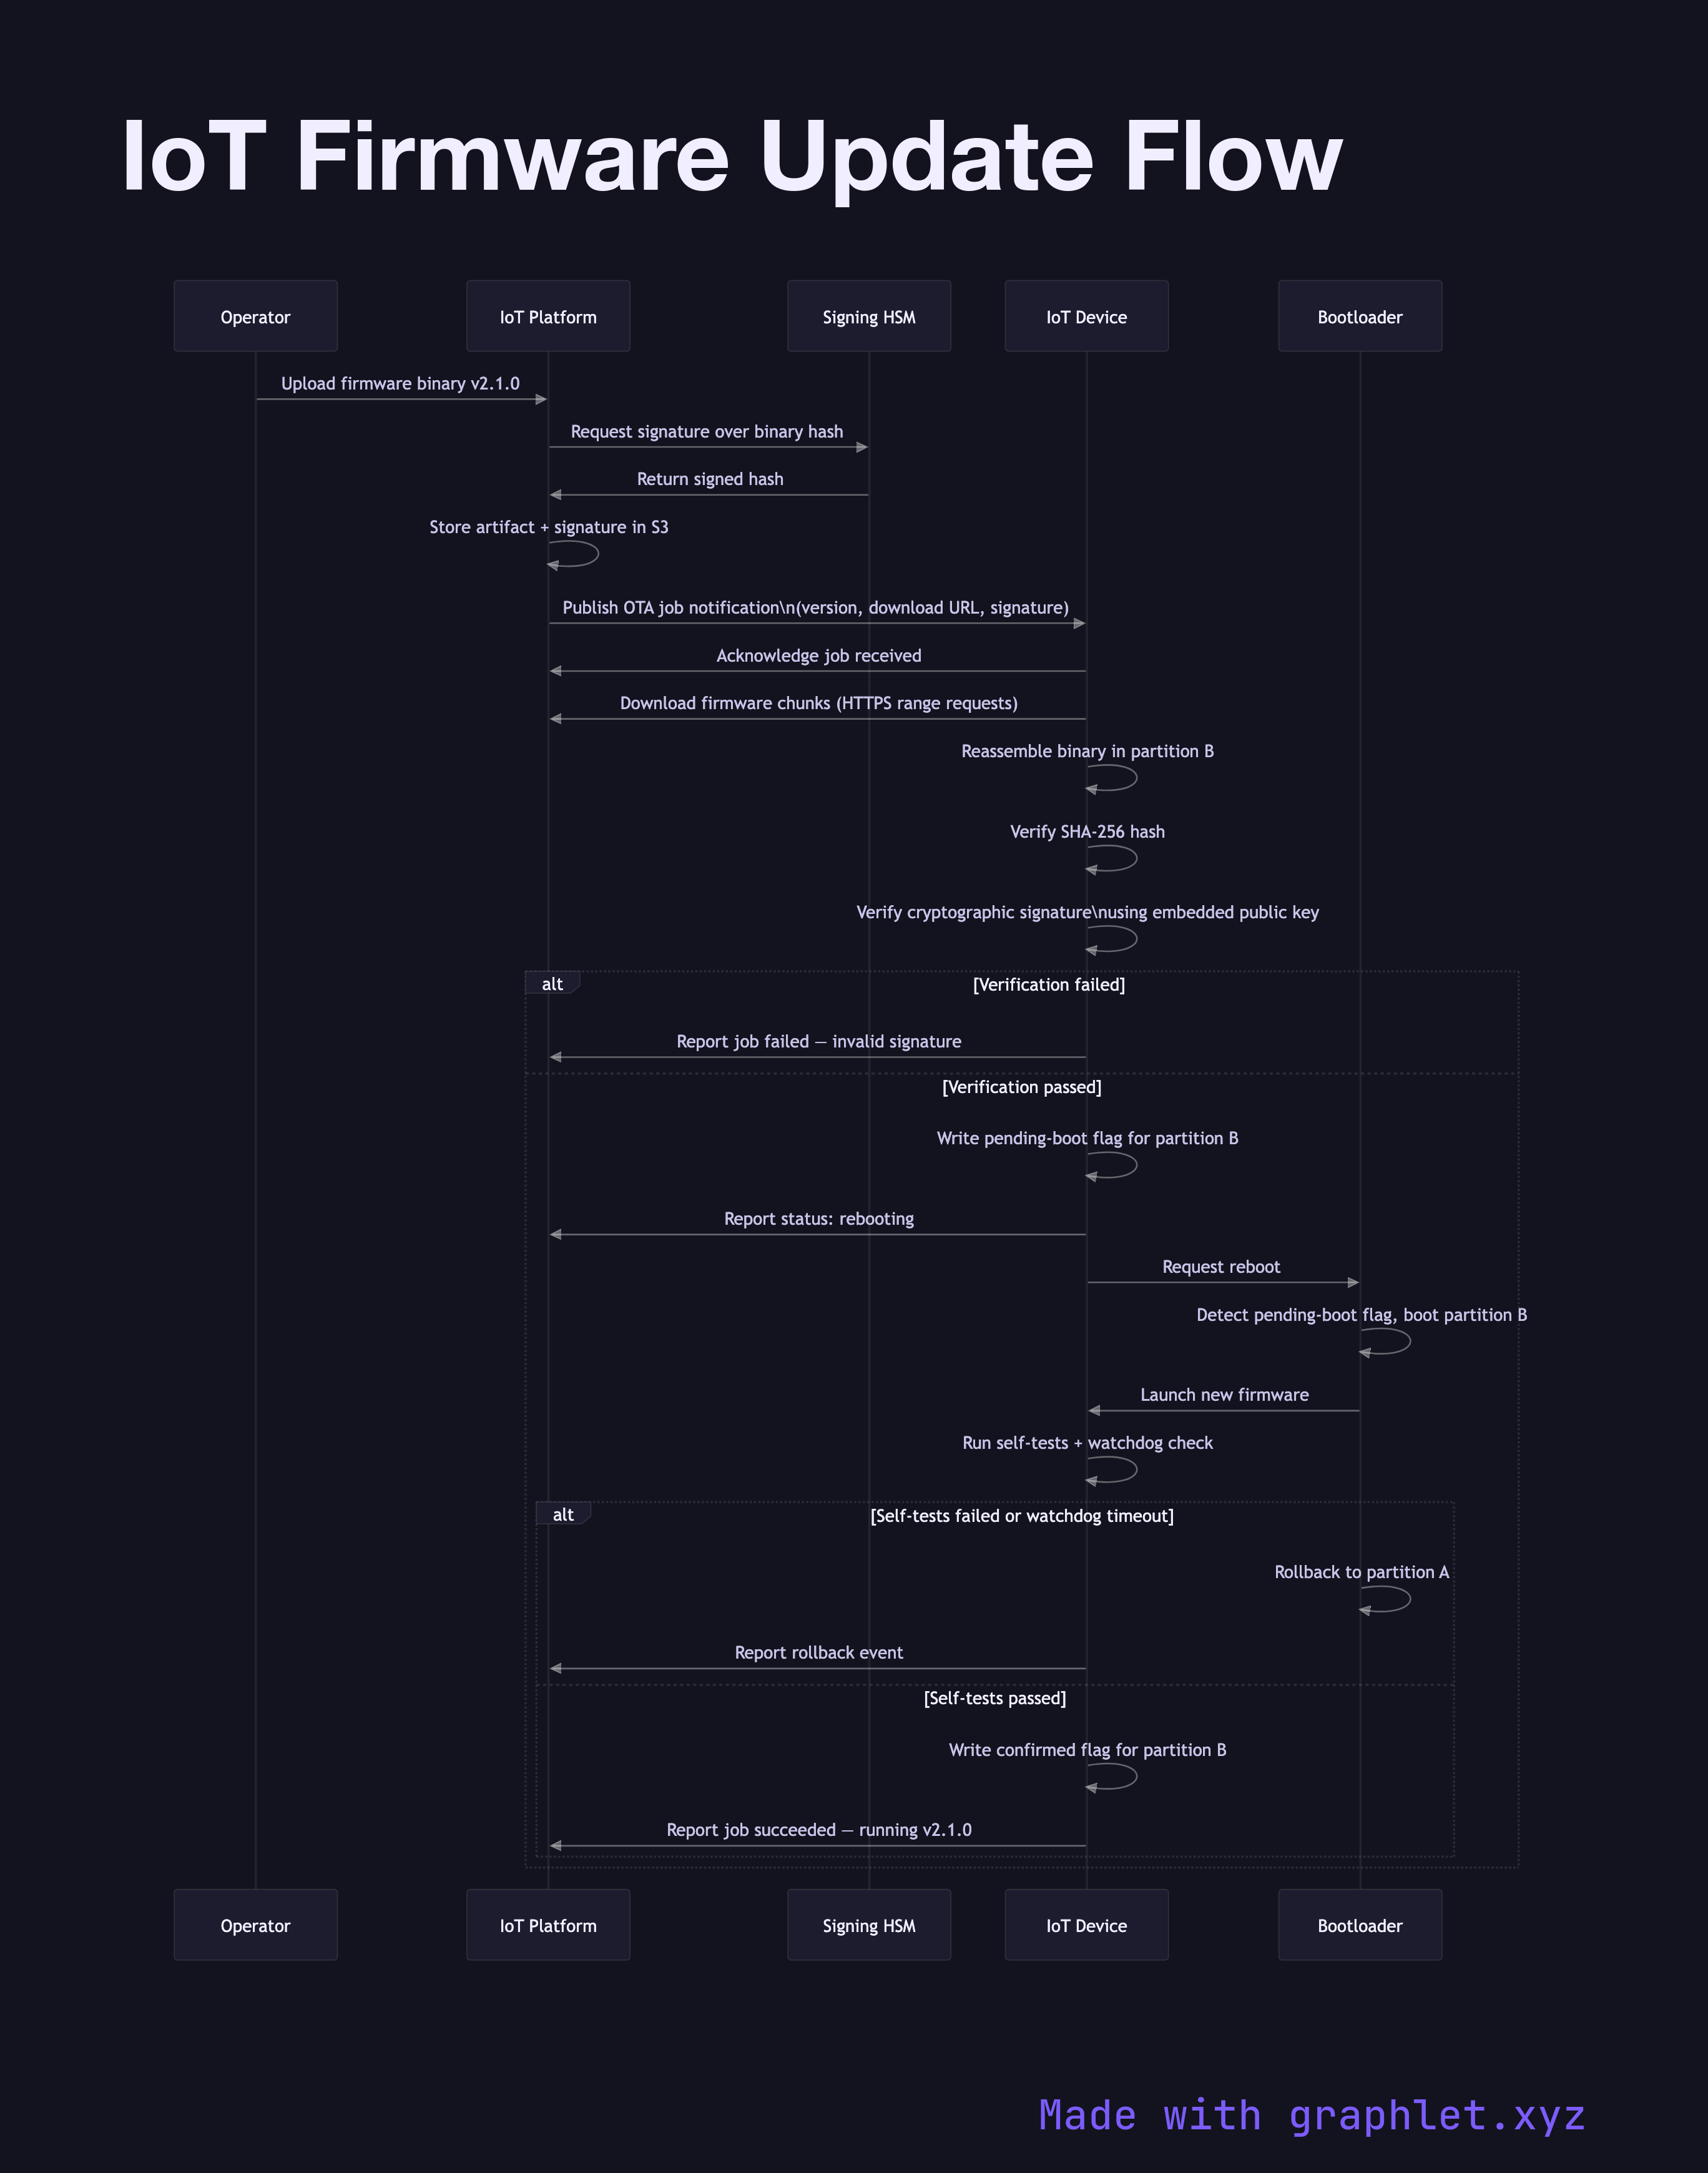
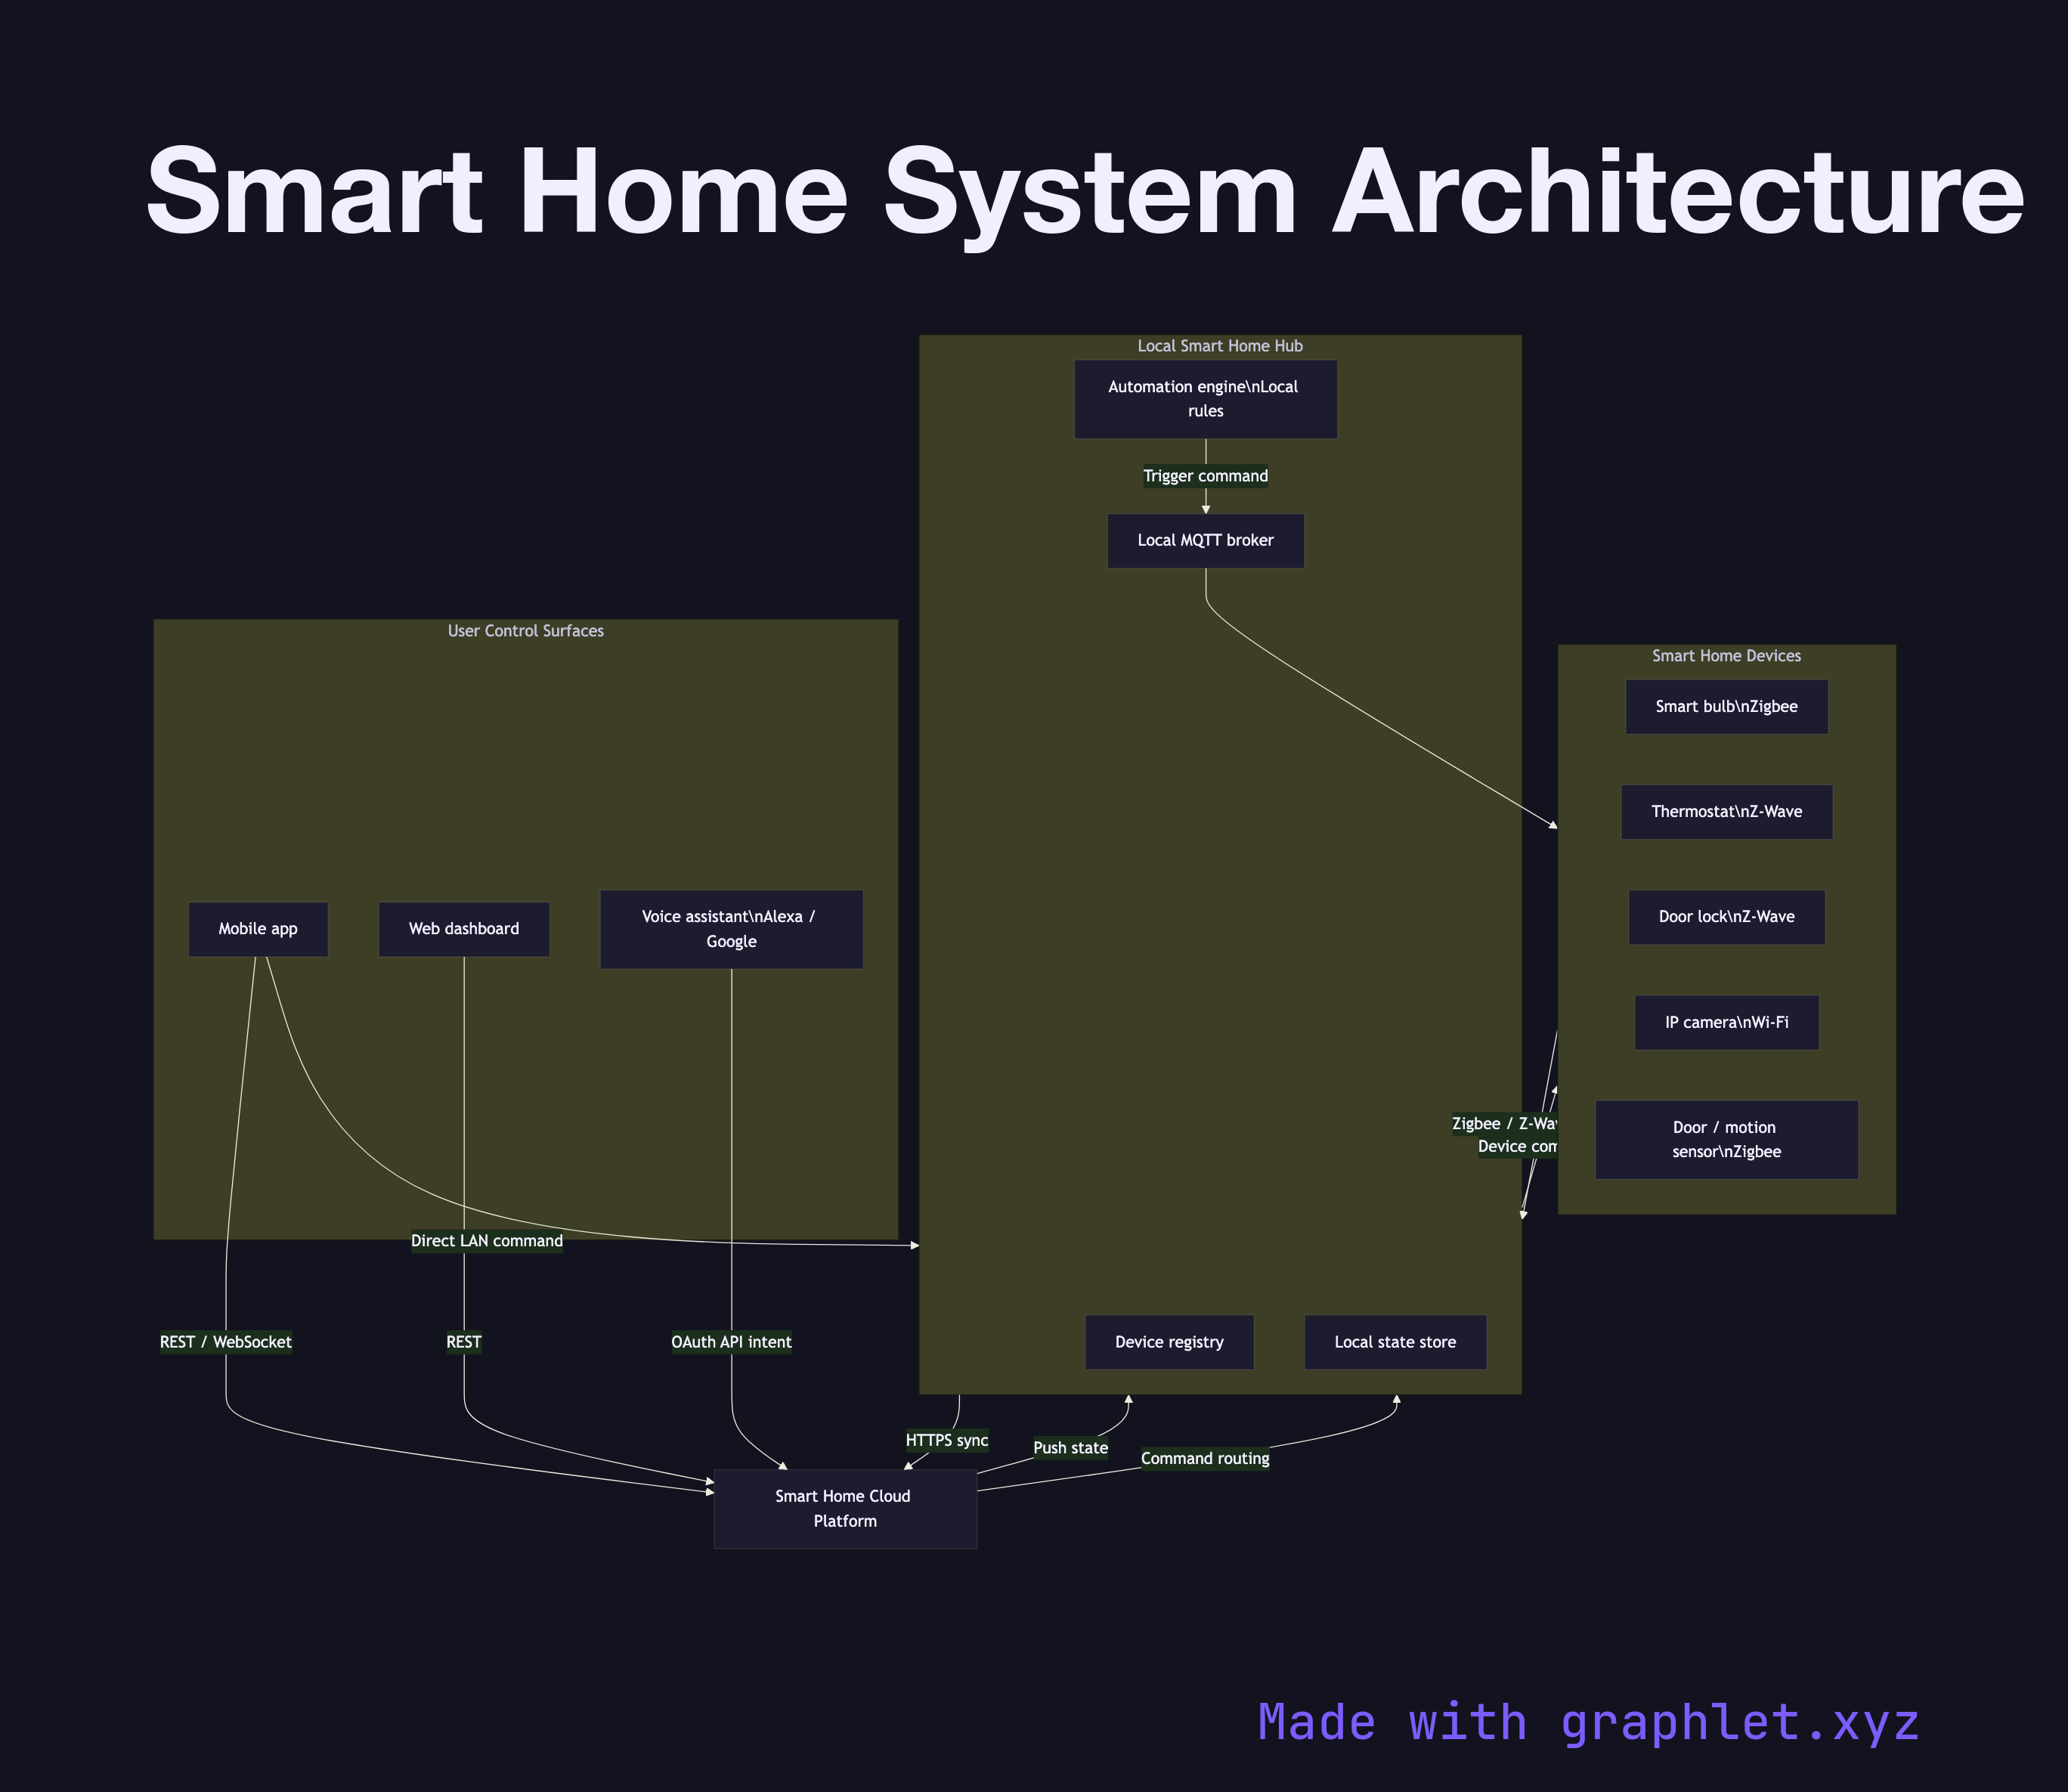
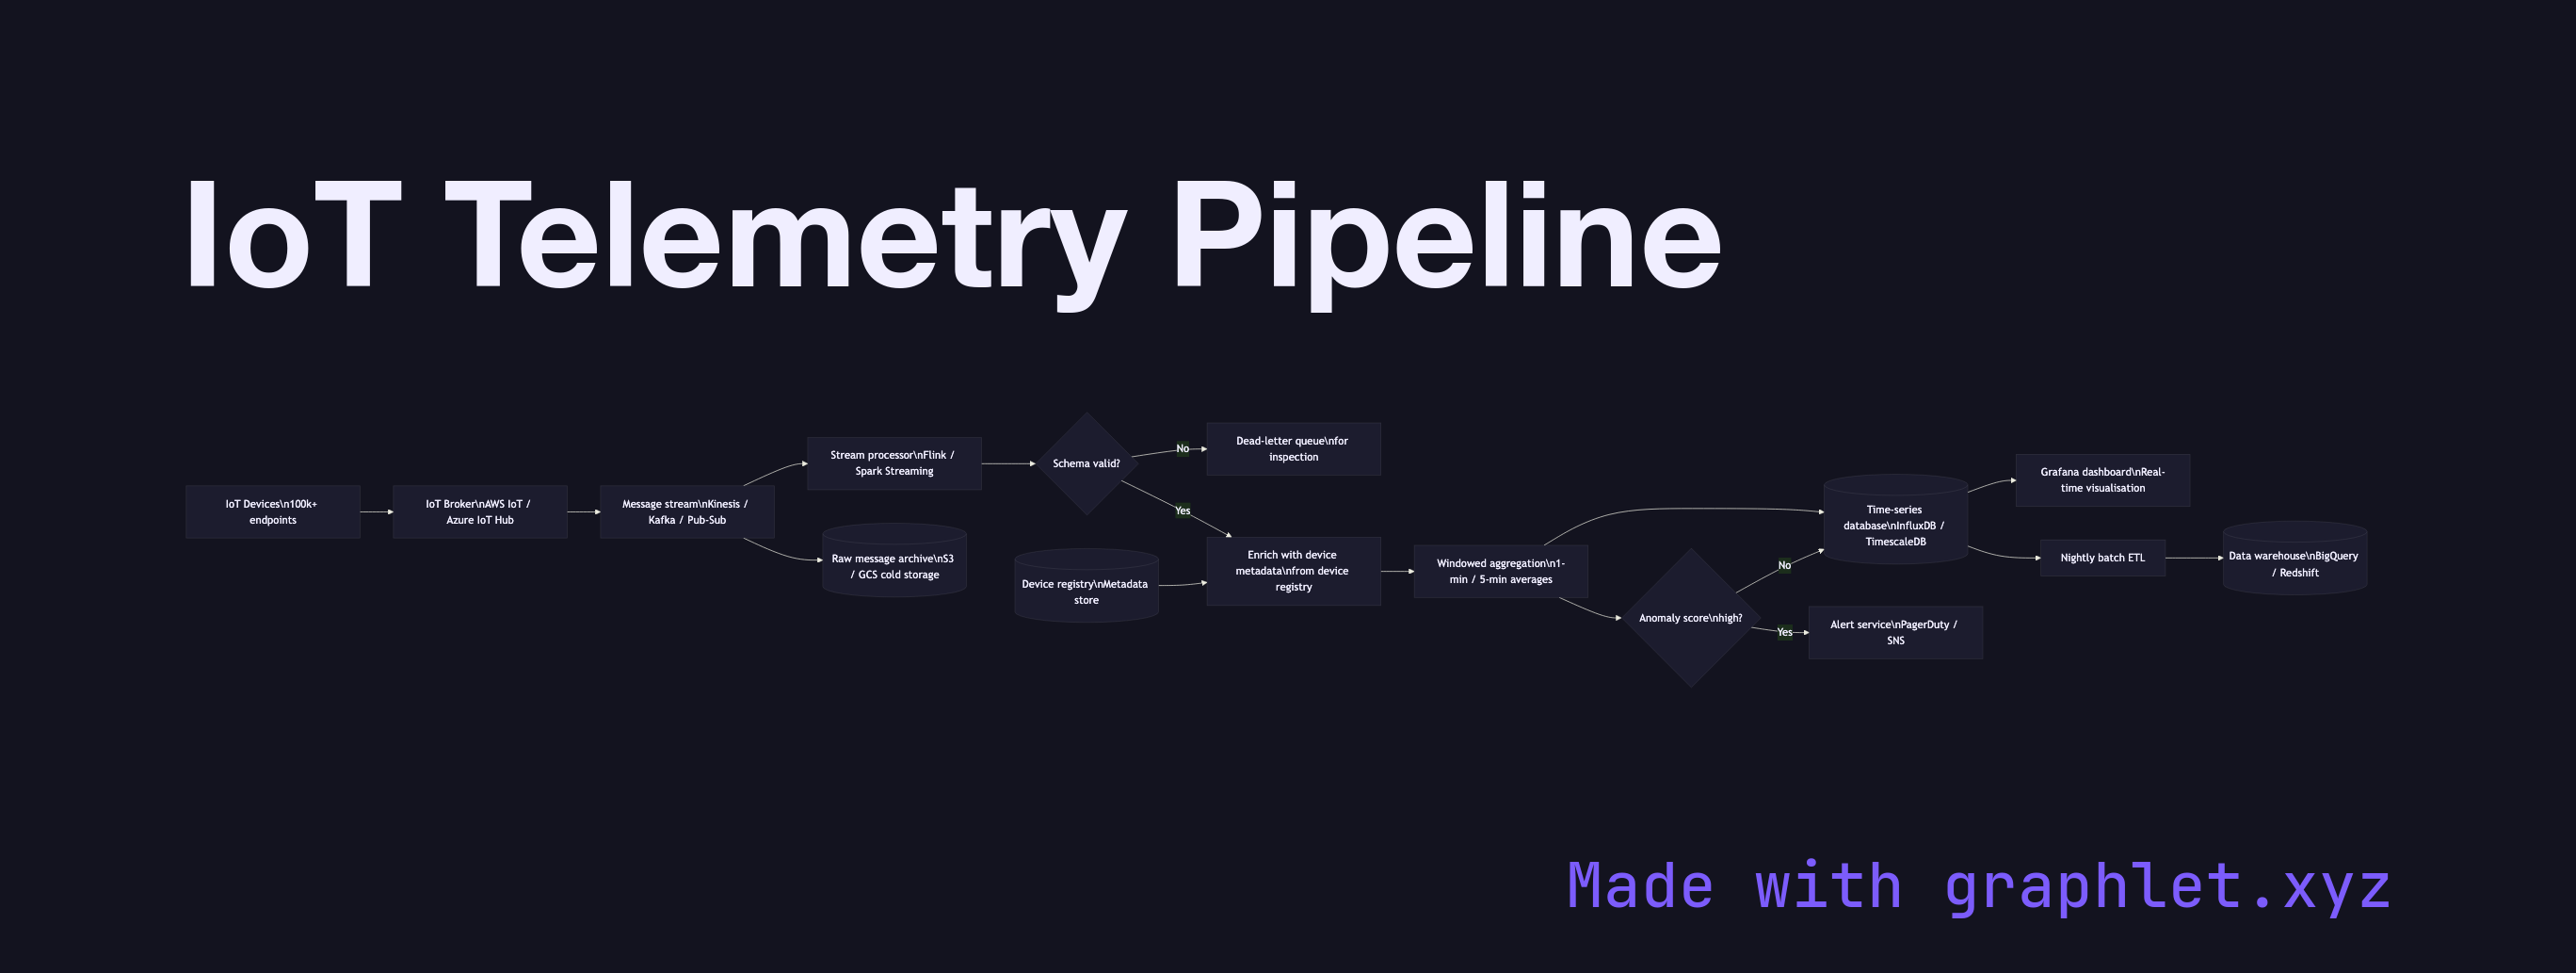
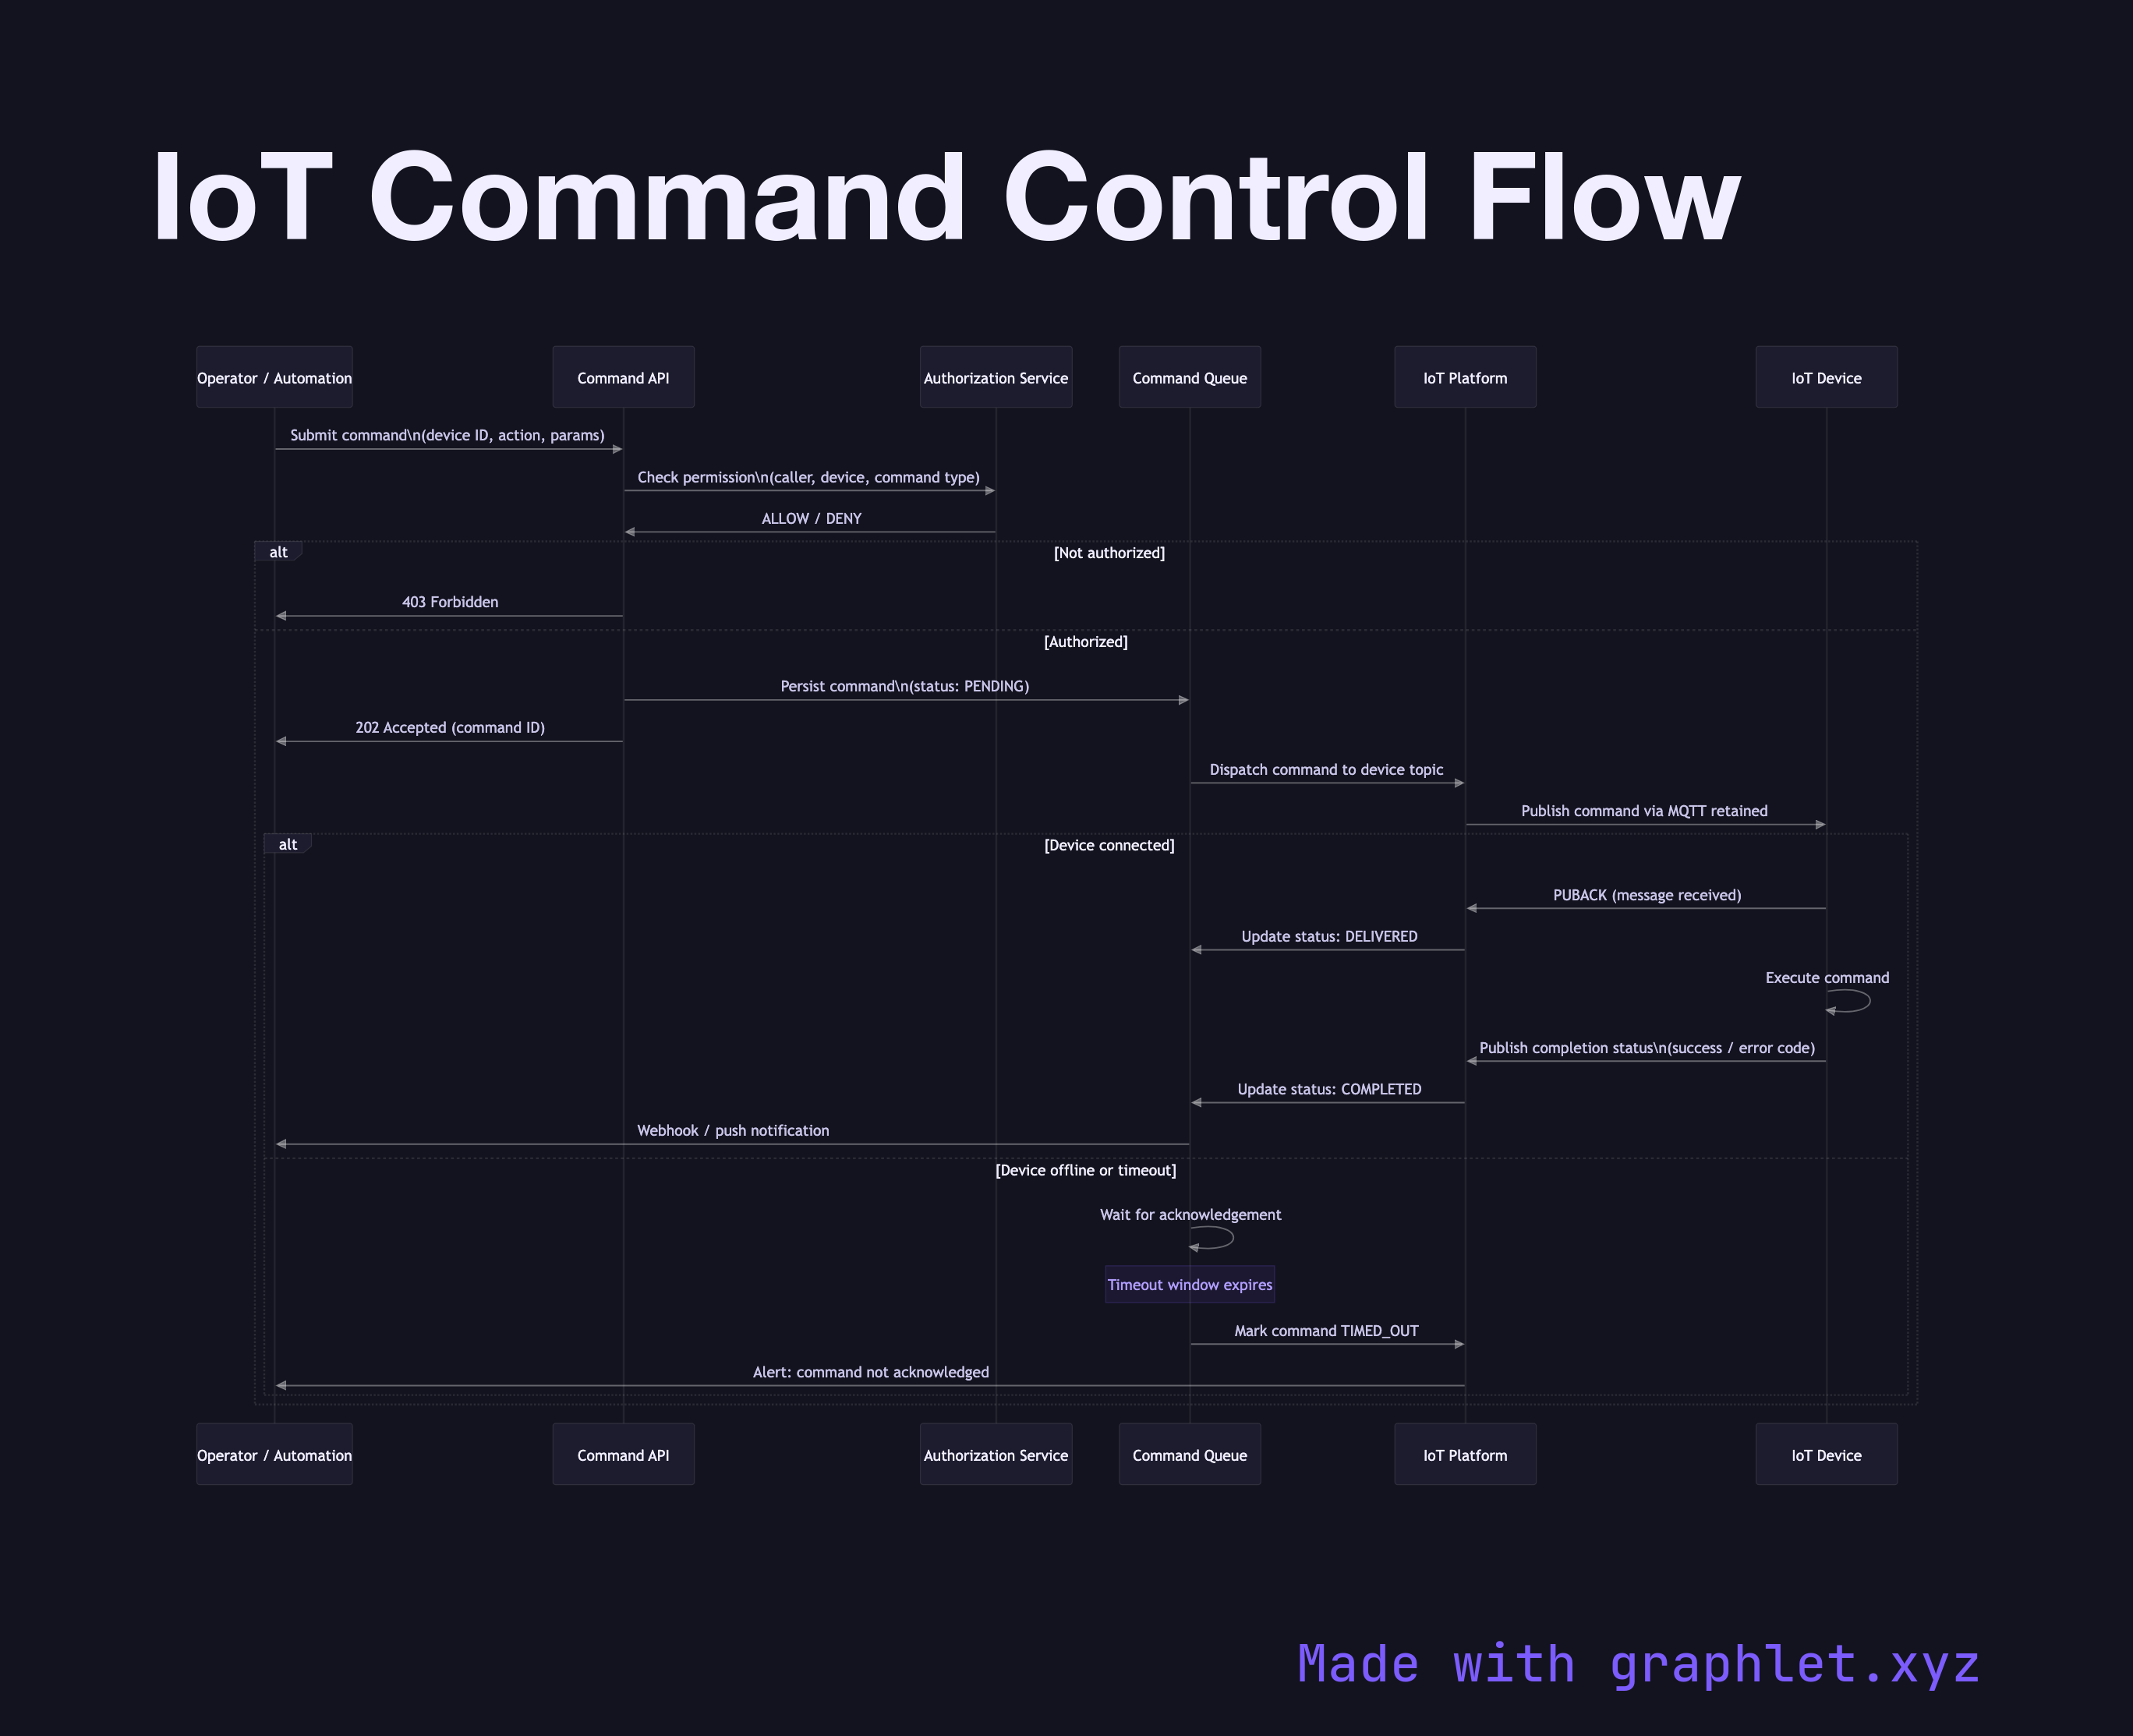
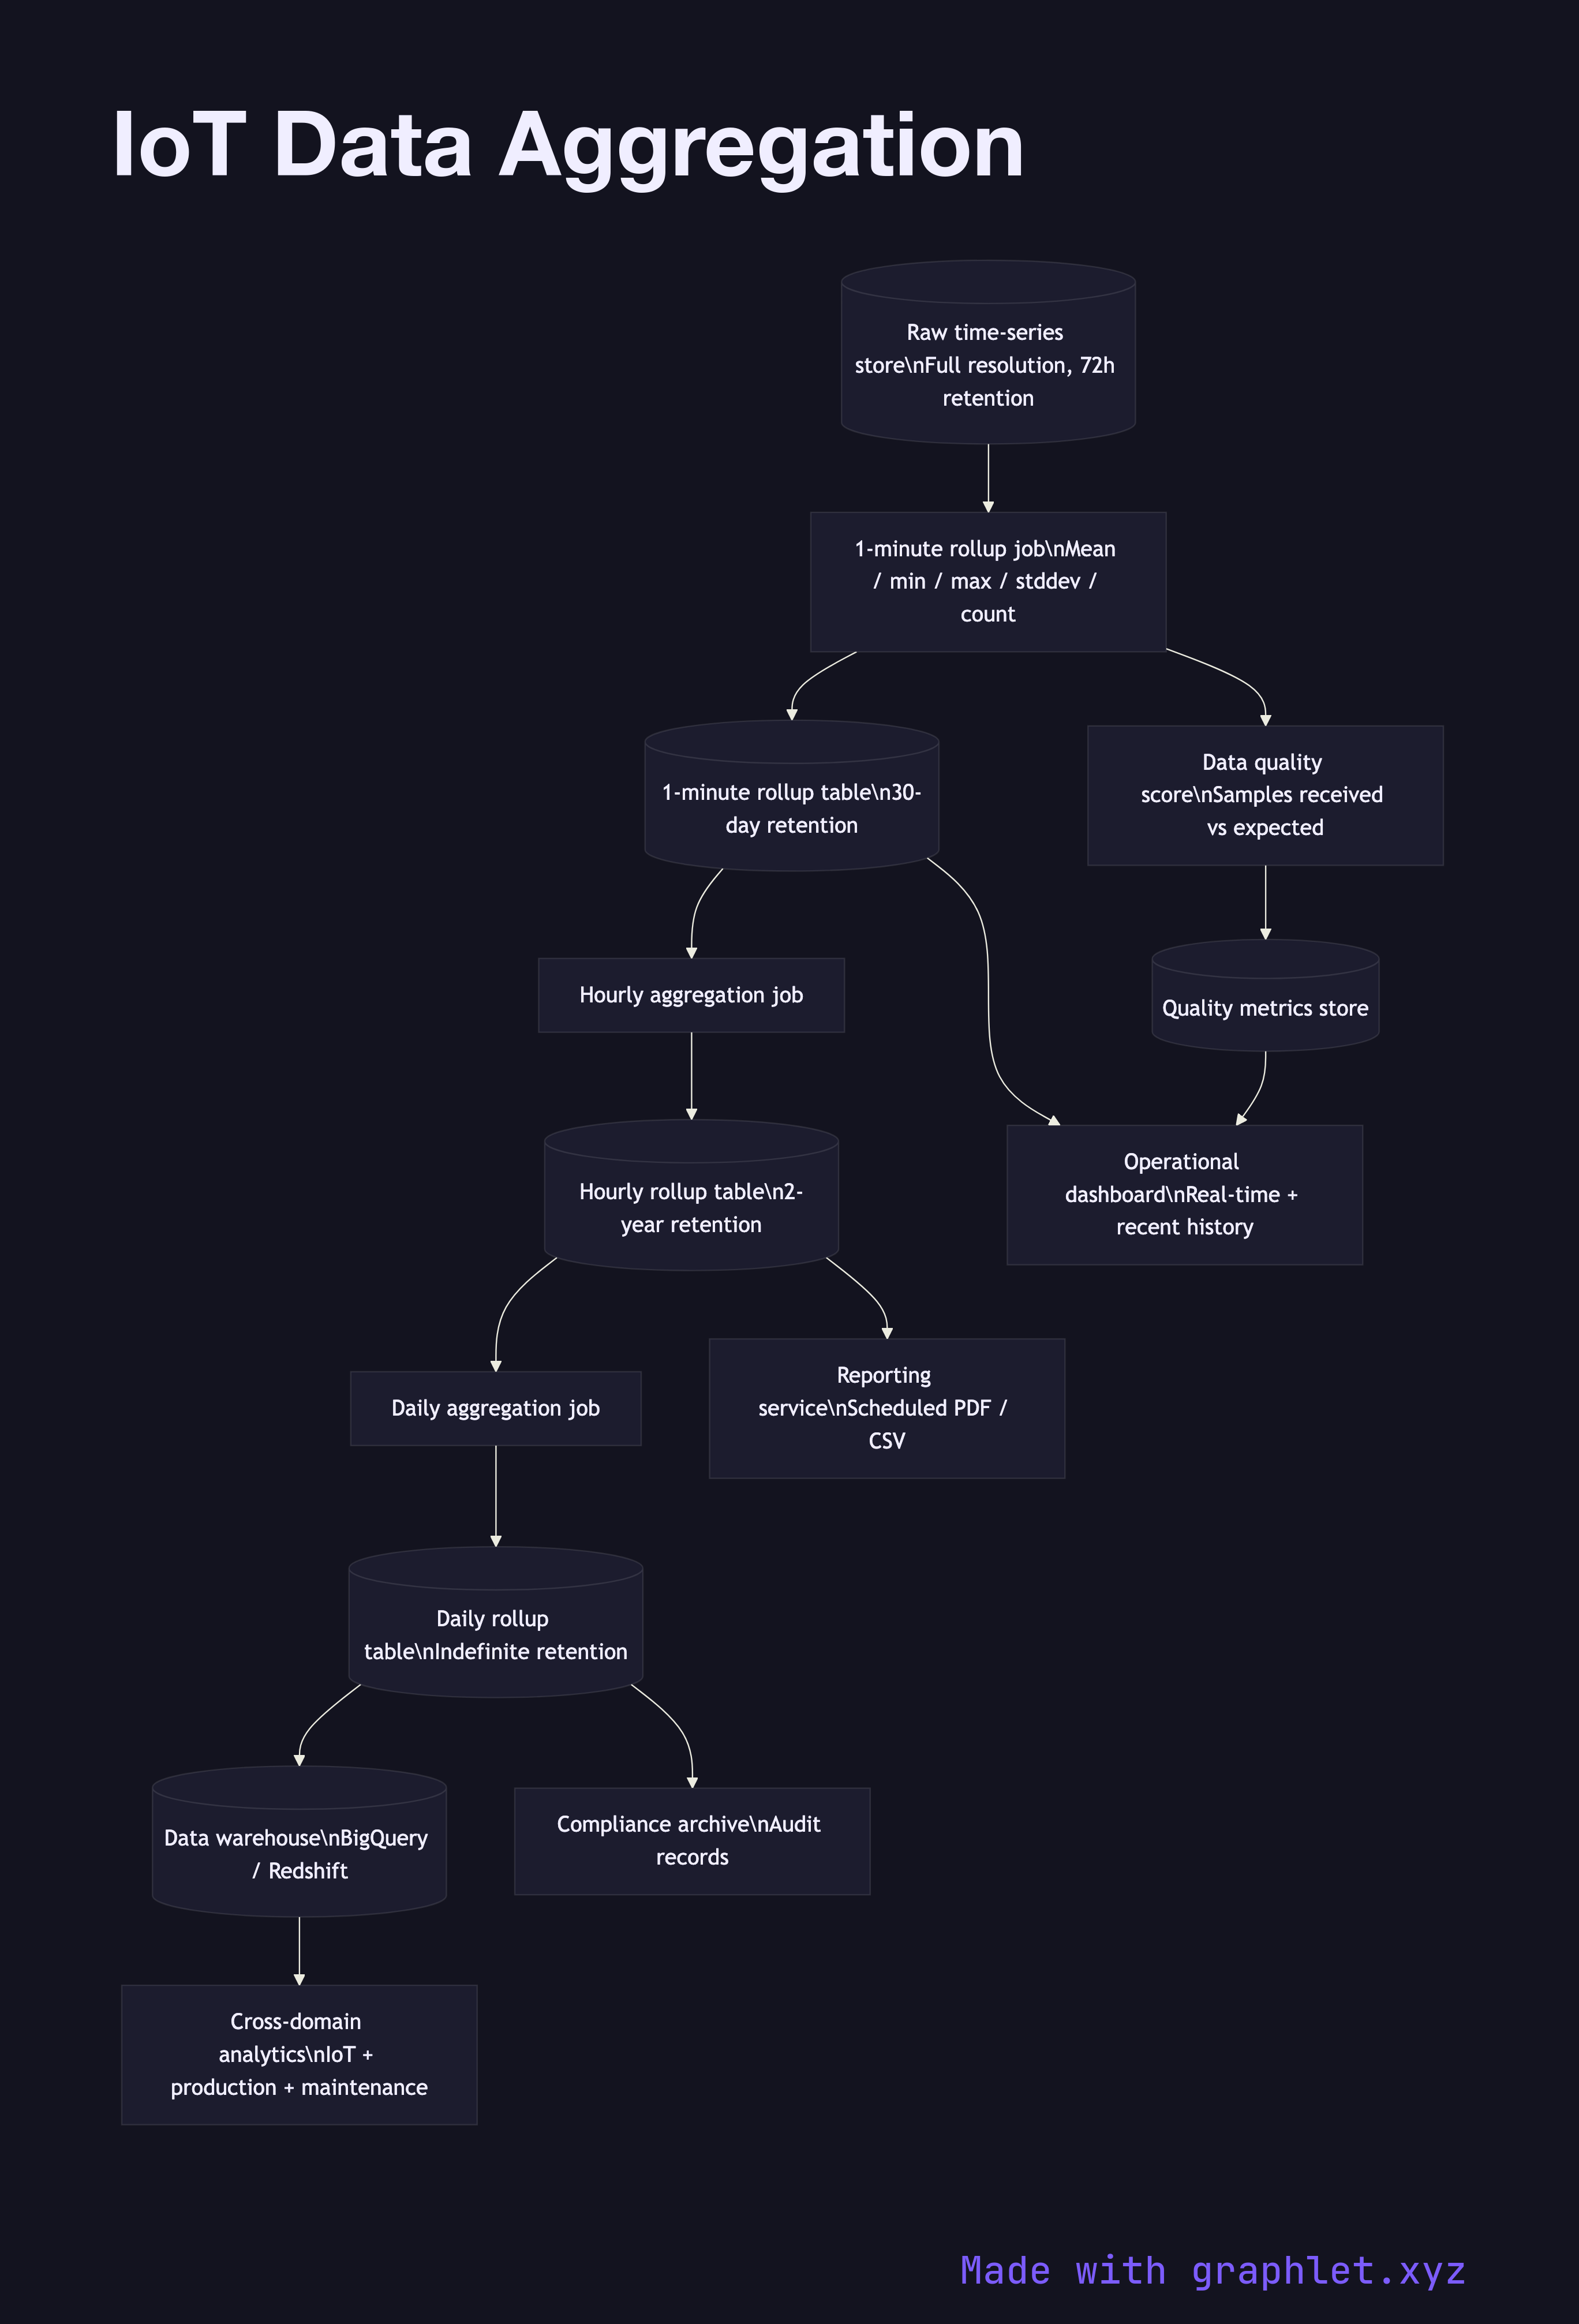
Security and operations are covered by IoT Device Authentication, IoT Firmware Update Flow, and IoT Command Control Flow. For analytics, IoT Telemetry Pipeline and IoT Data Aggregation show how time-series data is collected and rolled up. Smart Home System Architecture illustrates a consumer-facing end-to-end deployment. Every diagram opens in Graphlet for live editing and export.