Canary Deployment
A canary deployment gradually shifts a small percentage of production traffic to a new version of a service, monitoring metrics and error rates before incrementally increasing the rollout — allowing teams to catch regressions with minimal blast radius.
A canary deployment gradually shifts a small percentage of production traffic to a new version of a service, monitoring metrics and error rates before incrementally increasing the rollout — allowing teams to catch regressions with minimal blast radius.
What the diagram shows
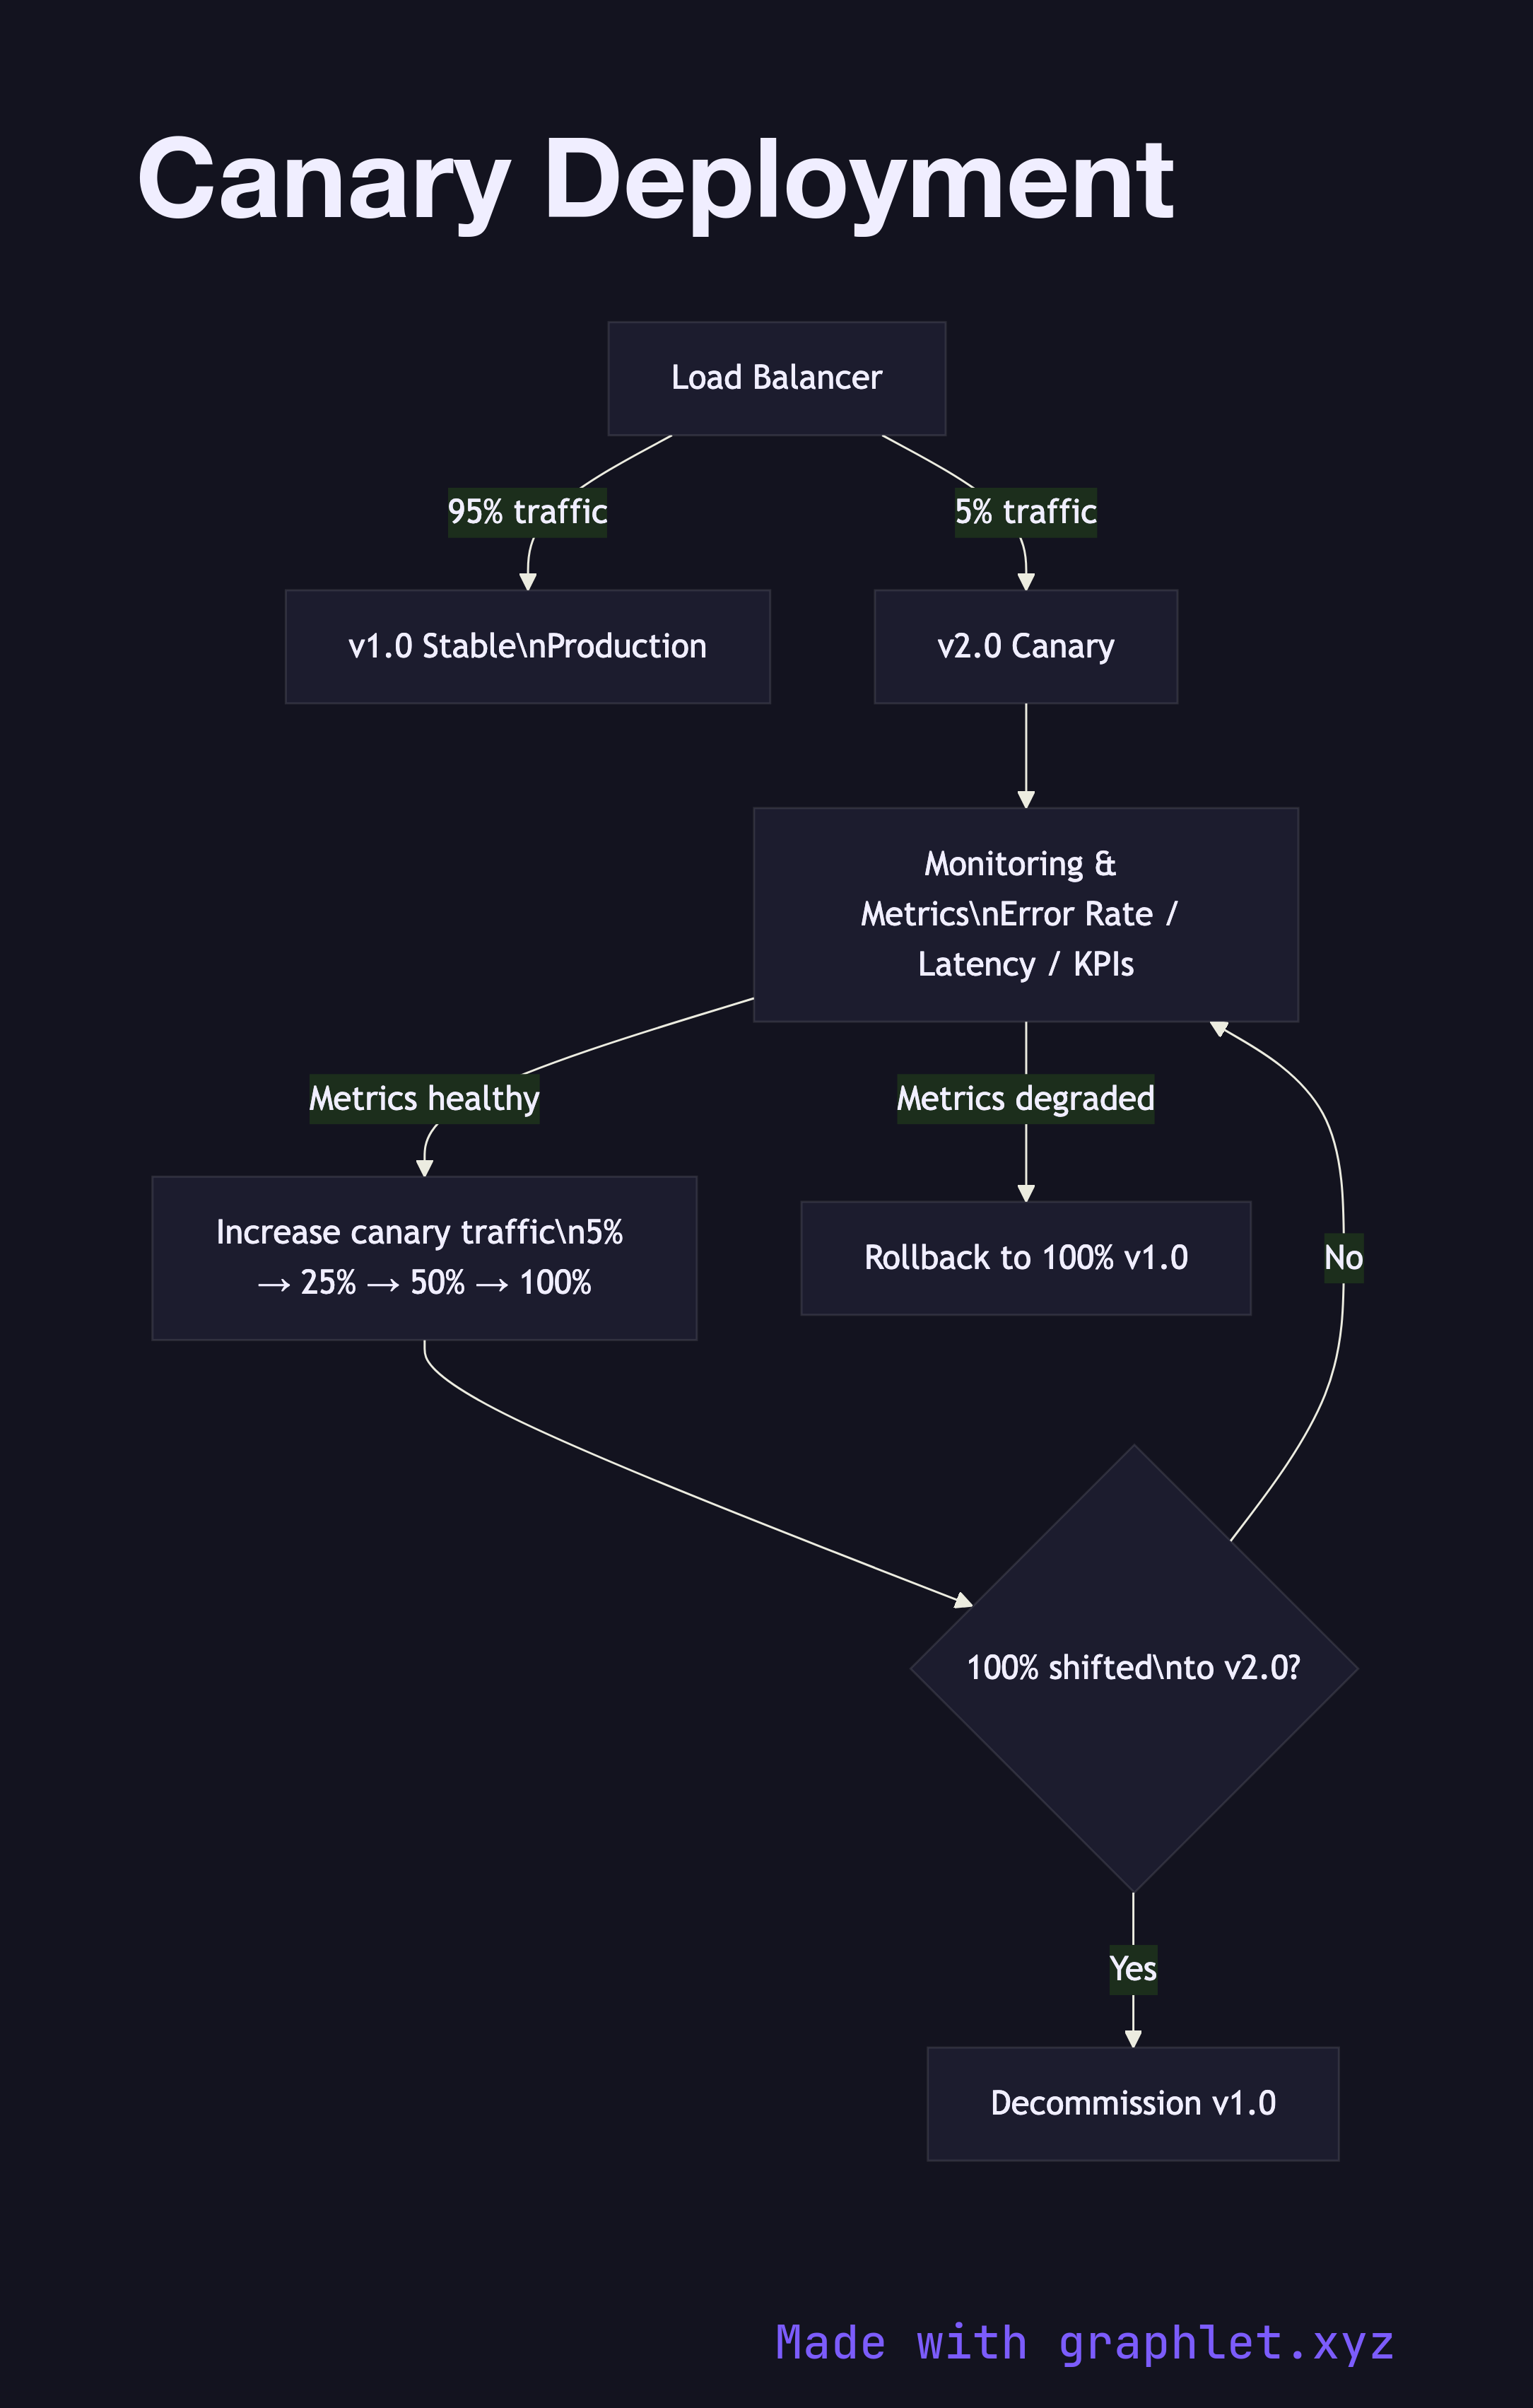
The diagram begins with the Load Balancer routing all traffic to v1.0 Stable (100%). When a new release is ready, the canary phase starts: the load balancer is reconfigured to send 5% of traffic to v2.0 Canary while 95% remains on v1.0. A Monitoring & Metrics gate continuously evaluates error rates, latency percentiles, and business KPIs for the canary cohort.
If metrics are healthy after an observation window (e.g. 30 minutes), traffic is increased incrementally — 5% → 25% → 50% → 100%. At each step, the monitoring gate re-evaluates. If any step shows degraded metrics, Rollback returns all traffic to v1.0 immediately. Once 100% has shifted successfully, v1.0 instances are decommissioned.
Why this matters
Canary deployments limit the impact of a bad release to only the percentage of users in the canary cohort. If a bug only manifests under specific real-world conditions, a 5% canary exposes it to real users while protecting the other 95%. Unlike Blue Green Deployment, canary doesn't require two full environments running simultaneously, reducing infrastructure cost. The trade-off is complexity in managing multiple live versions and ensuring the monitoring pipeline is reliable enough to make promotion decisions automatically.