Realtime Metrics Pipeline
A realtime metrics pipeline is a system that continuously ingests events, computes aggregations over short time windows, and delivers up-to-date metric values to dashboards and alerting systems — typically with end-to-end latency measured in seconds rather than minutes or hours.
A realtime metrics pipeline is a system that continuously ingests events, computes aggregations over short time windows, and delivers up-to-date metric values to dashboards and alerting systems — typically with end-to-end latency measured in seconds rather than minutes or hours.
Batch pipelines are the default for most analytics workloads: run a SQL job every hour, refresh the dashboard, move on. But some metrics cannot wait an hour. Site reliability engineers need to know the moment error rates spike. Operations teams need to know when order volume drops below expected thresholds. Growth teams want a live count of signups during a product launch. A realtime metrics pipeline makes these use cases possible by treating metrics computation as a continuous, stateful operation rather than a periodic query.
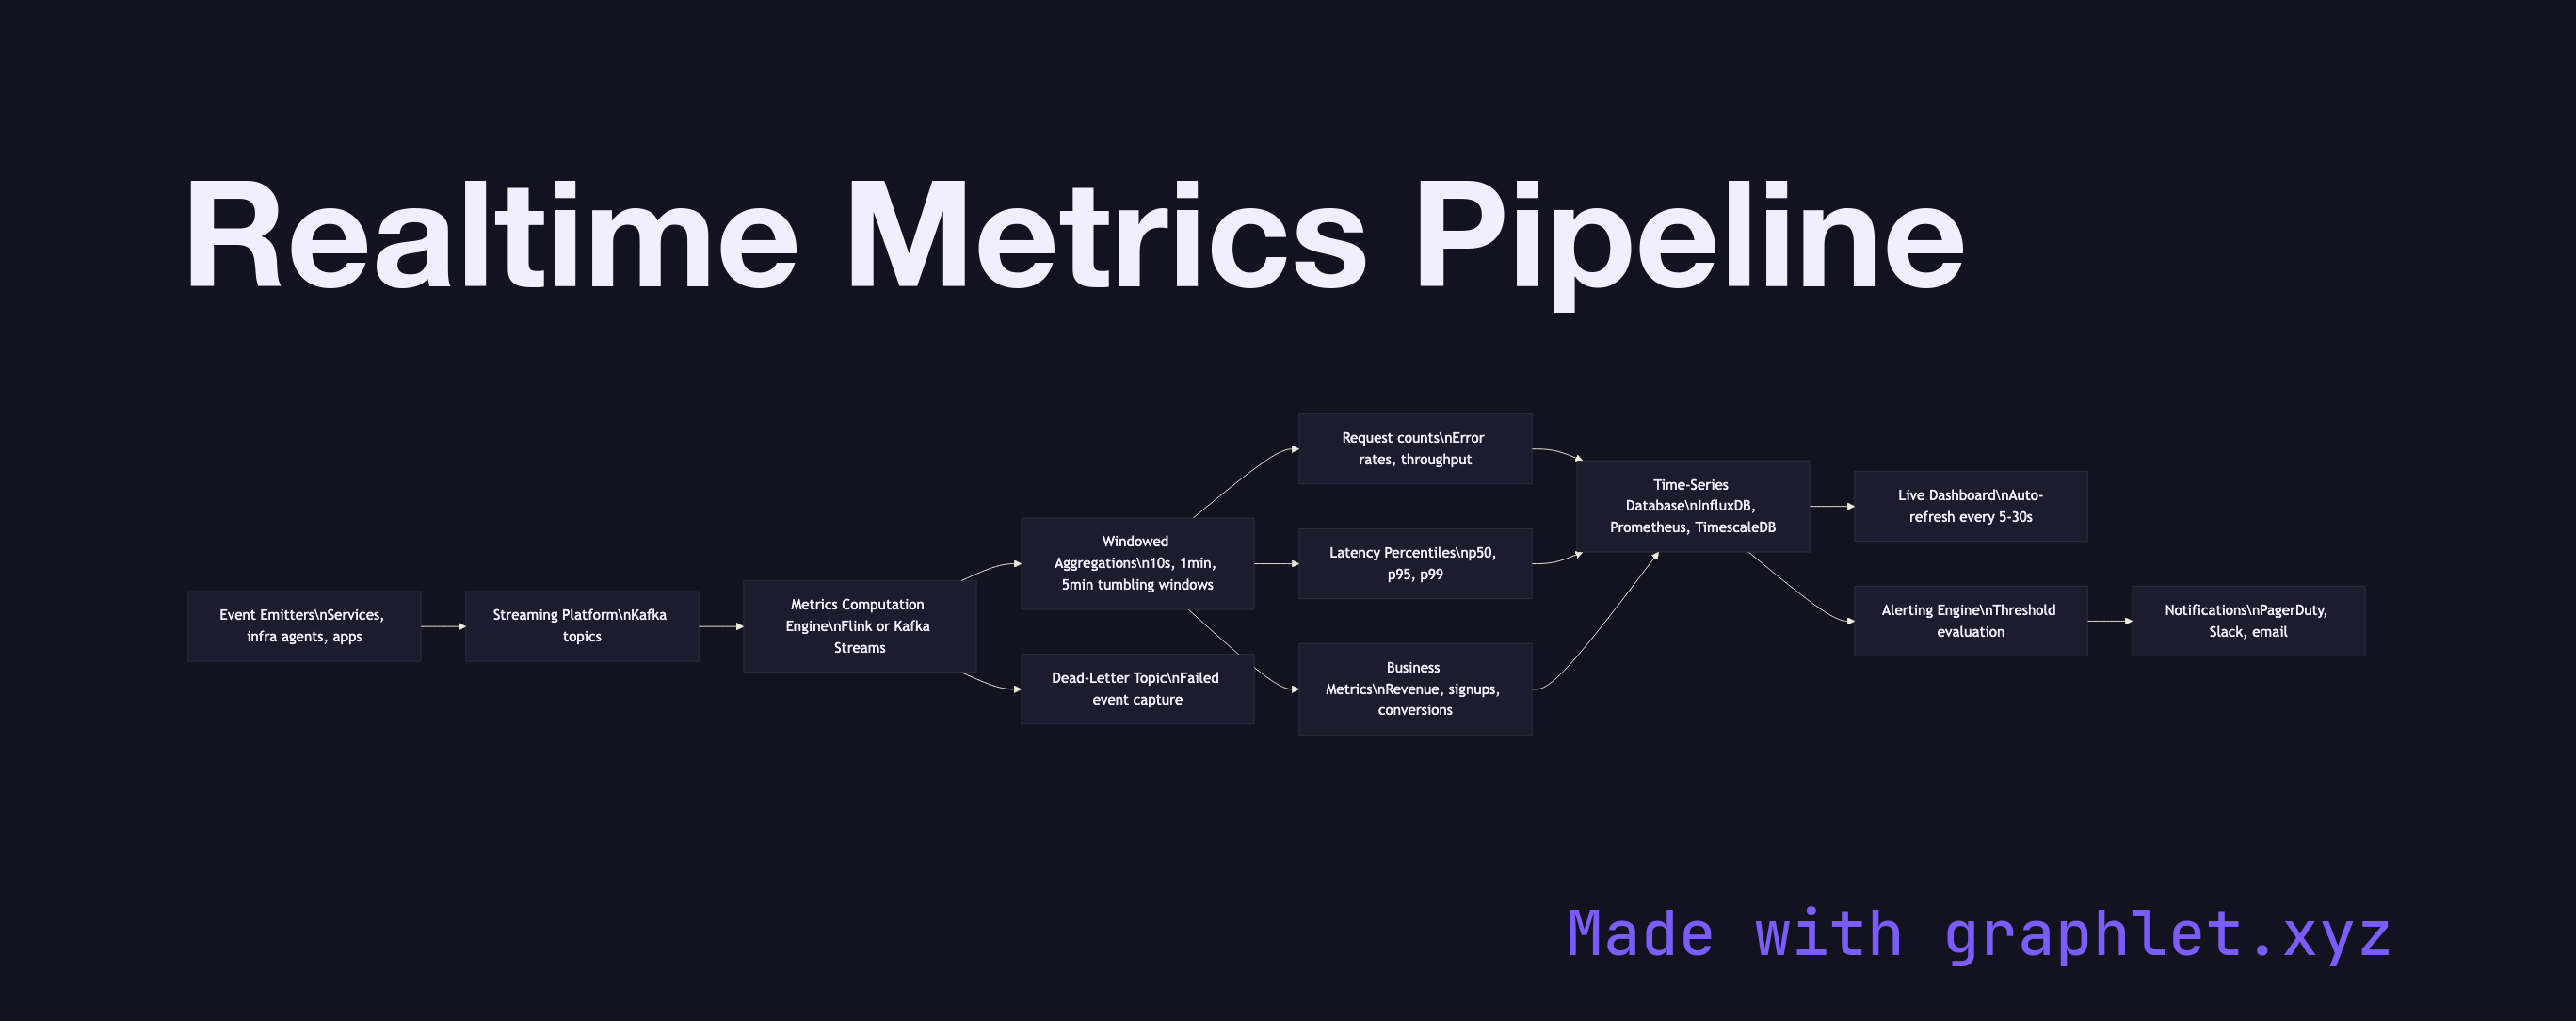
The pipeline begins with event emitters — application services, infrastructure agents, and user-facing products — that publish events to a streaming platform like Kafka as they occur. Each event carries a metric-relevant payload: an HTTP status code, a transaction amount, a user action type.
A metrics computation engine (Apache Flink, Kafka Streams, or a purpose-built metrics platform like VictoriaMetrics or Prometheus) consumes the event stream and applies windowed aggregations: computing request counts, error rates, p50/p95 latency percentiles, and revenue sums over tumbling windows of 10 seconds, 1 minute, and 5 minutes. The results are written continuously to a time-series database such as InfluxDB, Prometheus, or TimescaleDB — stores specifically designed for append-heavy writes and time-range queries.
A dashboard layer polls the time-series store on a configurable interval (typically every 5–30 seconds) and renders live-updating charts. In parallel, an alerting engine evaluates metric values against configured thresholds and fires notifications through PagerDuty, Slack, or email when a metric crosses a boundary. See Stream Analytics Architecture for the broader architectural patterns underlying this pipeline, and Analytics Dashboard Pipeline for how batch and realtime sources are combined in production dashboards.