Event Tracking Pipeline
An event tracking pipeline is the end-to-end system that captures discrete user or system actions, enriches them with contextual metadata, and delivers them to a durable store for analysis.
An event tracking pipeline is the end-to-end system that captures discrete user or system actions, enriches them with contextual metadata, and delivers them to a durable store for analysis.
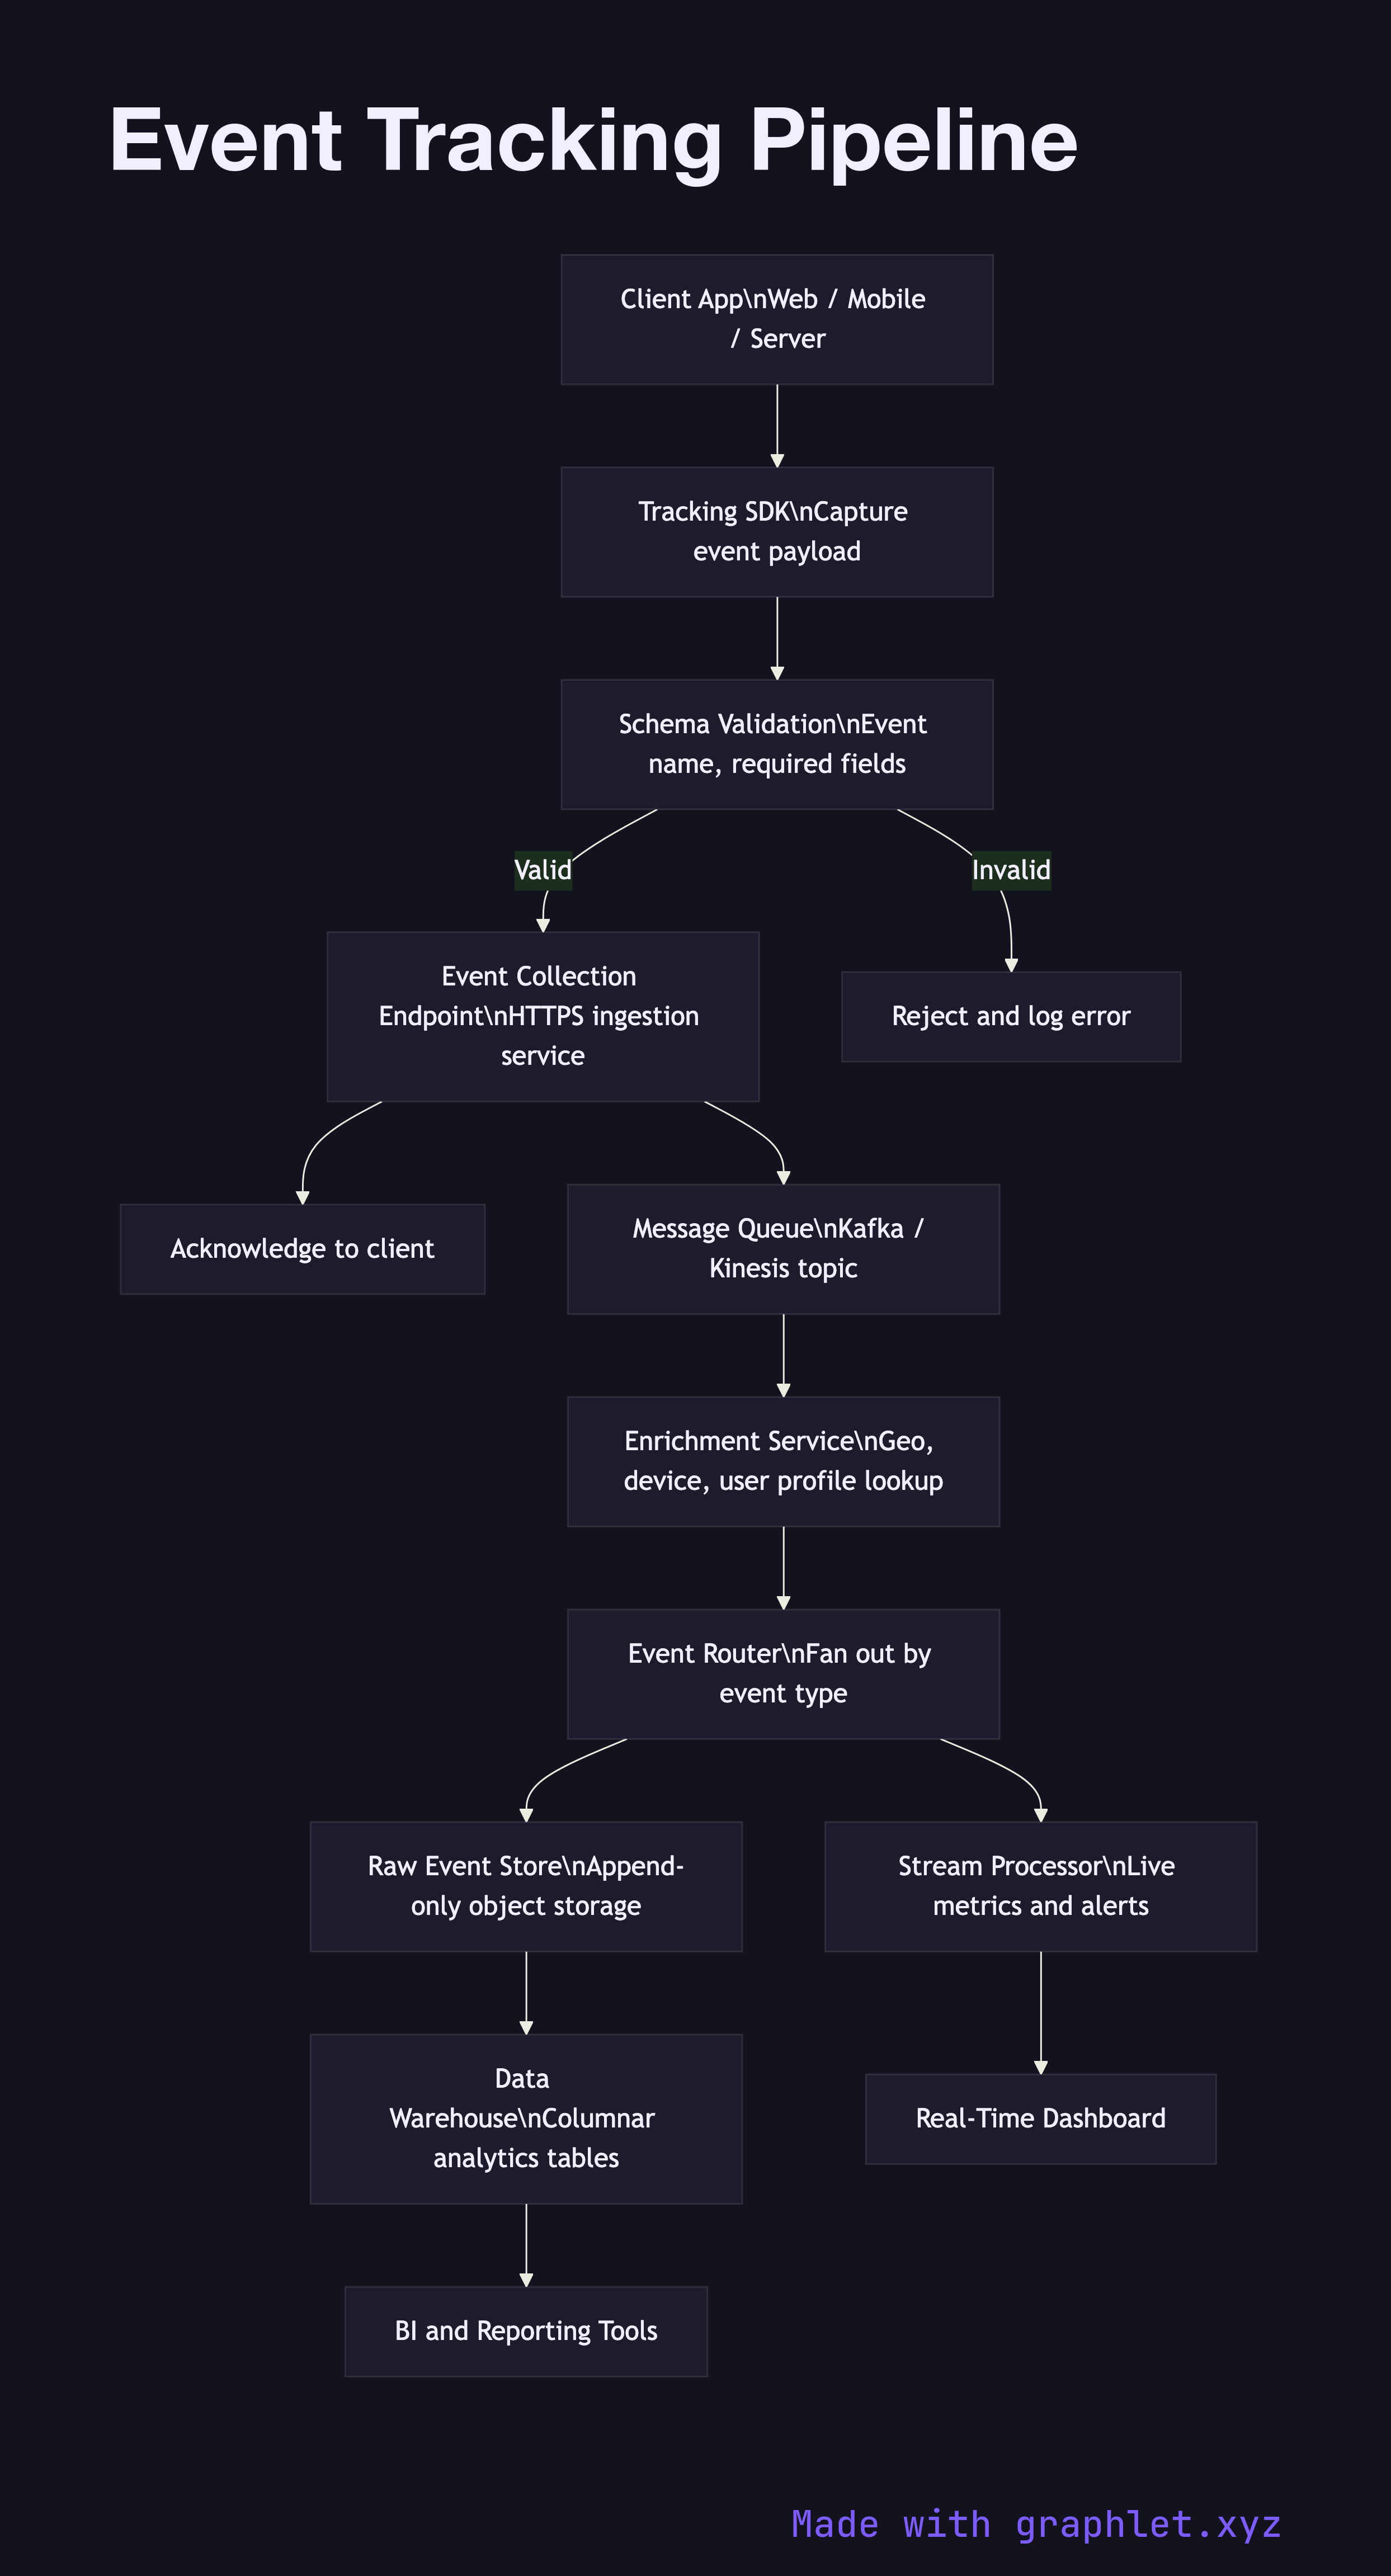
The pipeline begins at the client layer, where a tracking SDK (embedded in a web page, mobile app, or server process) intercepts user actions — clicks, page views, form submissions, API calls — and wraps them in a structured event payload. Each payload includes a timestamp, a session identifier, a user identifier (hashed or anonymous), and a strongly typed event name such as product.viewed or checkout.started.
Events are dispatched over HTTPS to an event collection endpoint — typically a lightweight ingestion service optimized for high write throughput. This endpoint validates the incoming payload schema against a registry and rejects malformed events immediately, preventing bad data from propagating downstream. Valid events are acknowledged to the client to prevent retries and duplicate submissions.
From the collection endpoint, events are forwarded to a message queue or streaming bus (such as Kafka or Kinesis). Decoupling ingestion from processing this way allows the downstream pipeline to absorb traffic spikes without dropping events. Consumer services read from this queue and apply enrichment: looking up user attributes from a profile store, appending device and geo metadata derived from the request headers, and resolving anonymous IDs to known users where a match exists.
Enriched events pass through a routing layer that fans them out based on event type. High-priority behavioral events go to a real-time stream processor for live dashboards and alerting (see Realtime Metrics Pipeline). All events are also written to a raw event store — typically an append-only object store or a columnar warehouse table — which serves as the system of record for replay and backfill. See Data Ingestion Pipeline for how bulk event data moves into a structured warehouse layer, and User Behavior Tracking for how individual event streams are assembled into behavioral profiles.