Analytics Dashboard Pipeline
An analytics dashboard pipeline is the system that moves data from its source systems all the way to the visualizations end-users interact with — covering ingestion, transformation, caching, and the query path that powers every chart refresh.
An analytics dashboard pipeline is the system that moves data from its source systems all the way to the visualizations end-users interact with — covering ingestion, transformation, caching, and the query path that powers every chart refresh.
Dashboards are often the most visible part of an analytics system, but the quality of what users see depends entirely on the pipeline behind it. A dashboard that shows stale data, loads slowly, or produces inconsistent numbers across charts is a symptom of pipeline problems, not a visualization problem. Understanding the full pipeline is essential for building dashboards that are fast, accurate, and trustworthy.
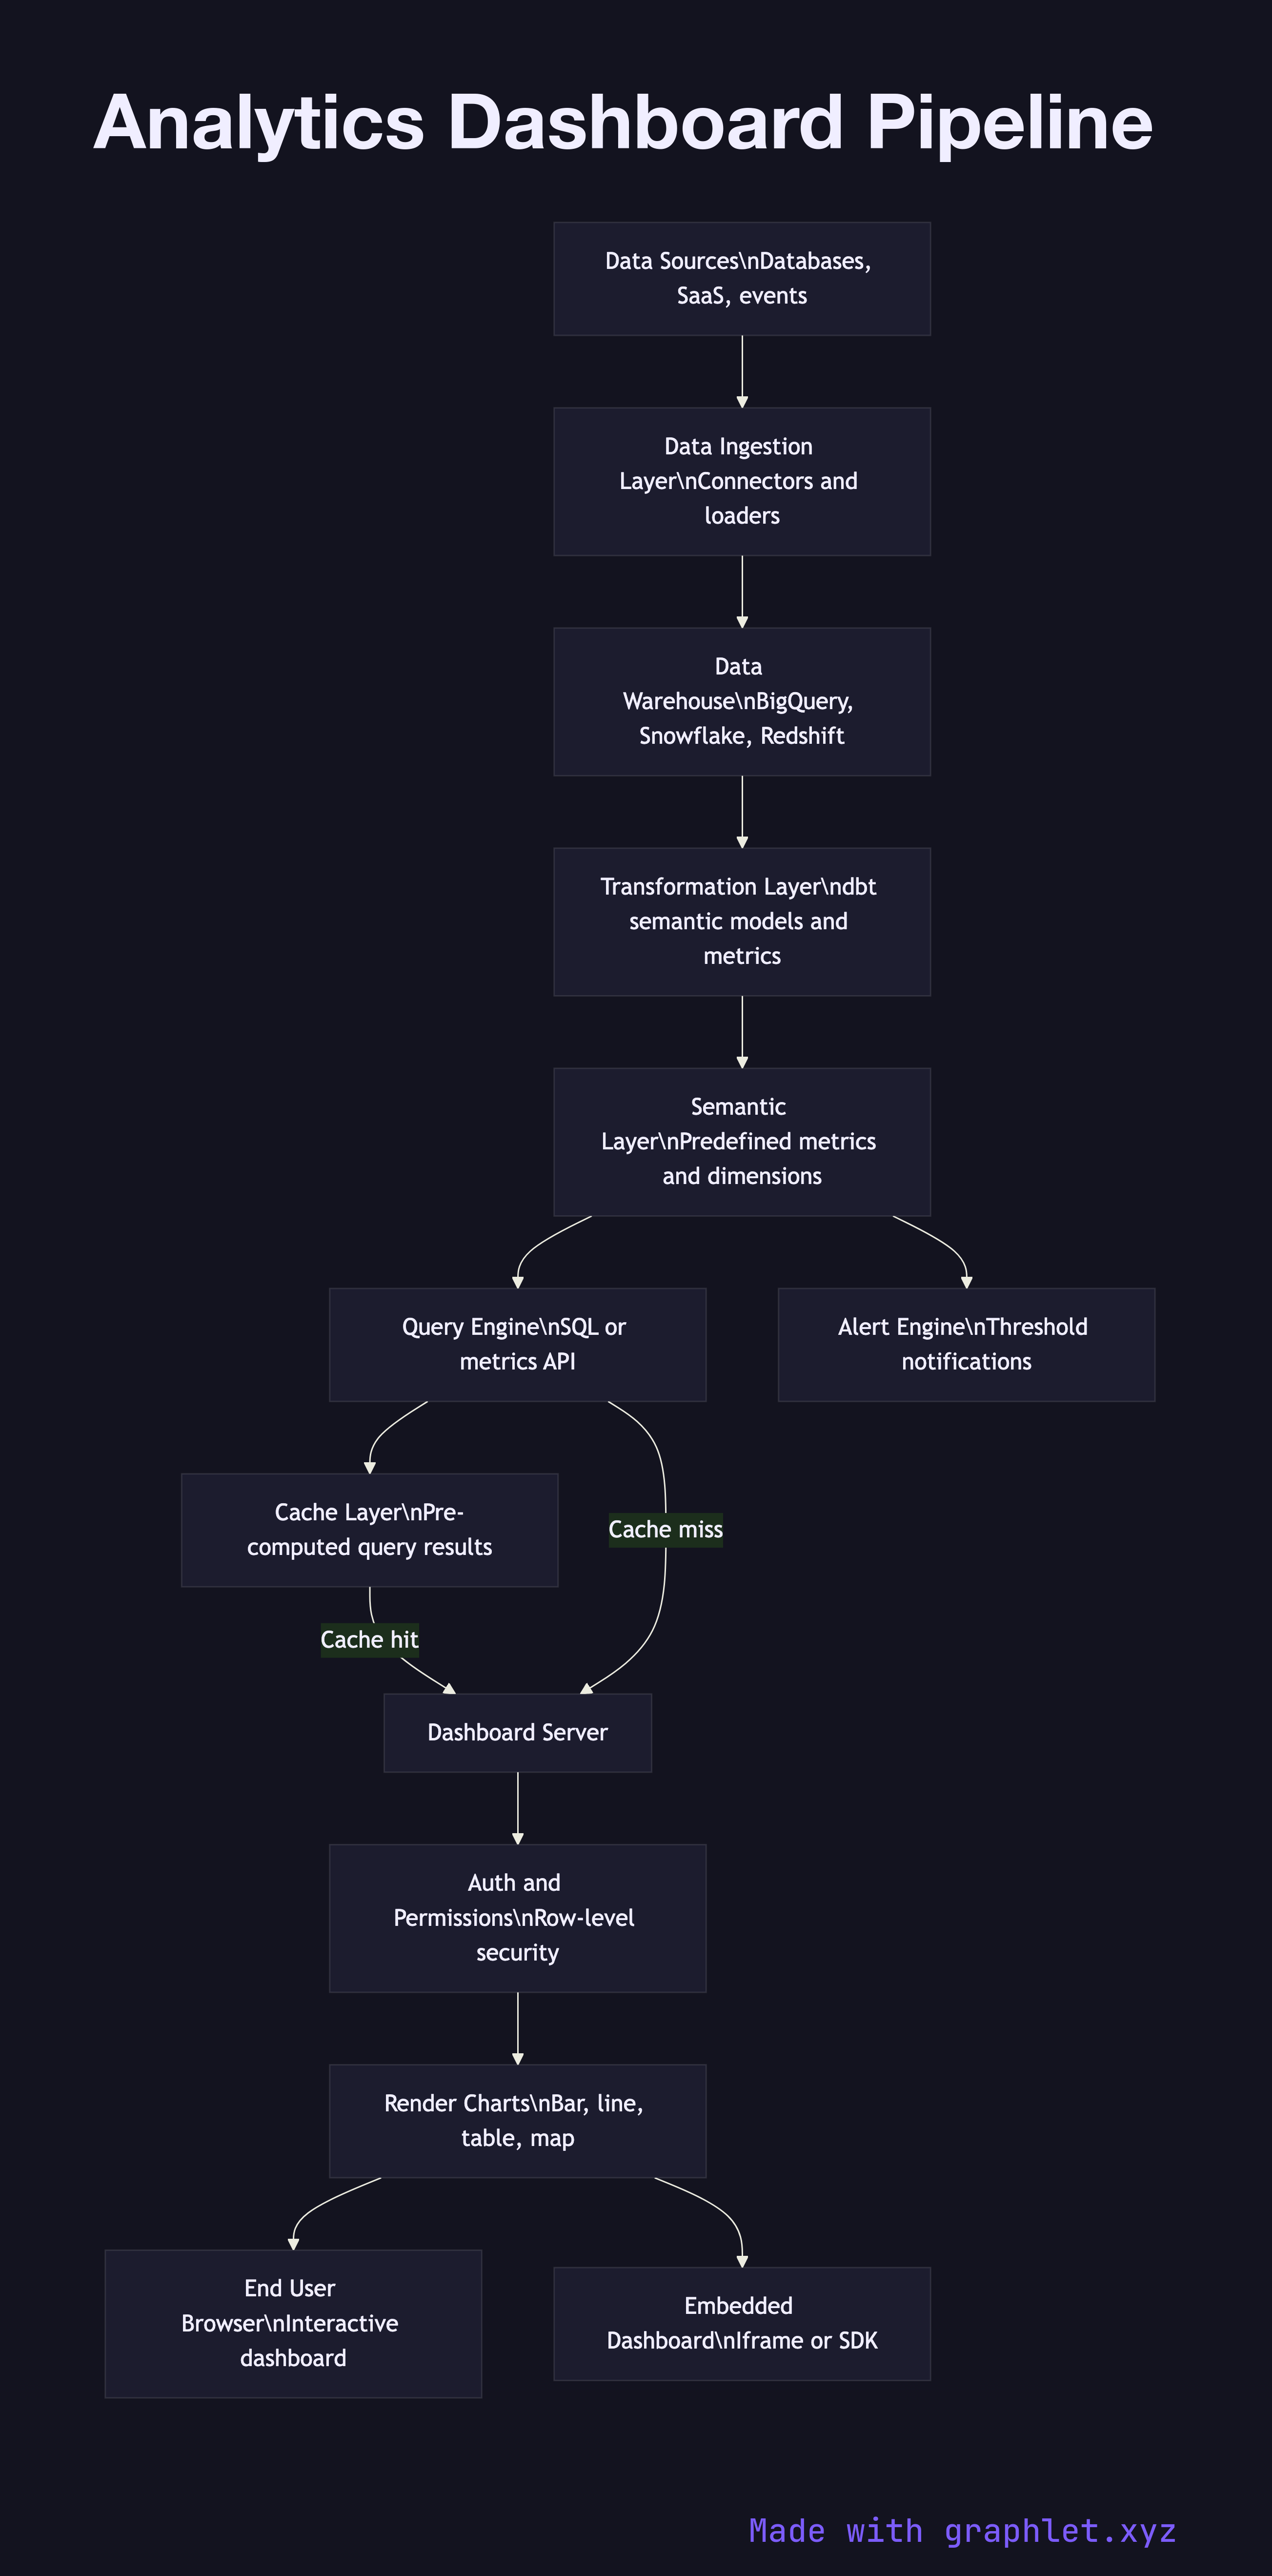
The pipeline begins with the data sources: operational databases, SaaS platforms, and event streams that feed a central store via a Data Ingestion Pipeline. After ingestion, transformation jobs (typically dbt models) reshape raw data into semantic layer models — predefined metrics and dimensions that give every dashboard widget a consistent, business-aligned definition. When revenue is defined once in a model and referenced everywhere, it cannot diverge across charts.
The semantic layer is served through a query engine — a data warehouse like BigQuery or Snowflake, or a purpose-built metrics layer like Cube or Superset. Dashboard tools send SQL or API queries to this engine. For dashboards with high refresh frequency or large user bases, a cache layer intercepts repeat queries and returns pre-computed results within milliseconds, reducing warehouse cost and improving perceived load time.
A dashboard server handles user authentication, permission enforcement (row-level security to restrict which data each user sees), and rendering of chart configurations into visual output. The final delivery layer serves dashboard embeds or full applications to end users via browser or mobile. See Realtime Metrics Pipeline for how live-updating dashboards connect to streaming data rather than scheduled batch refreshes.