Modern analytics systems are built on a series of interconnected pipelines that move data from raw sources to actionable insights. Whether you are instrumenting a product, building a data warehouse, or processing millions of events per second, understanding how data flows through your infrastructure is critical for both engineers and data teams.
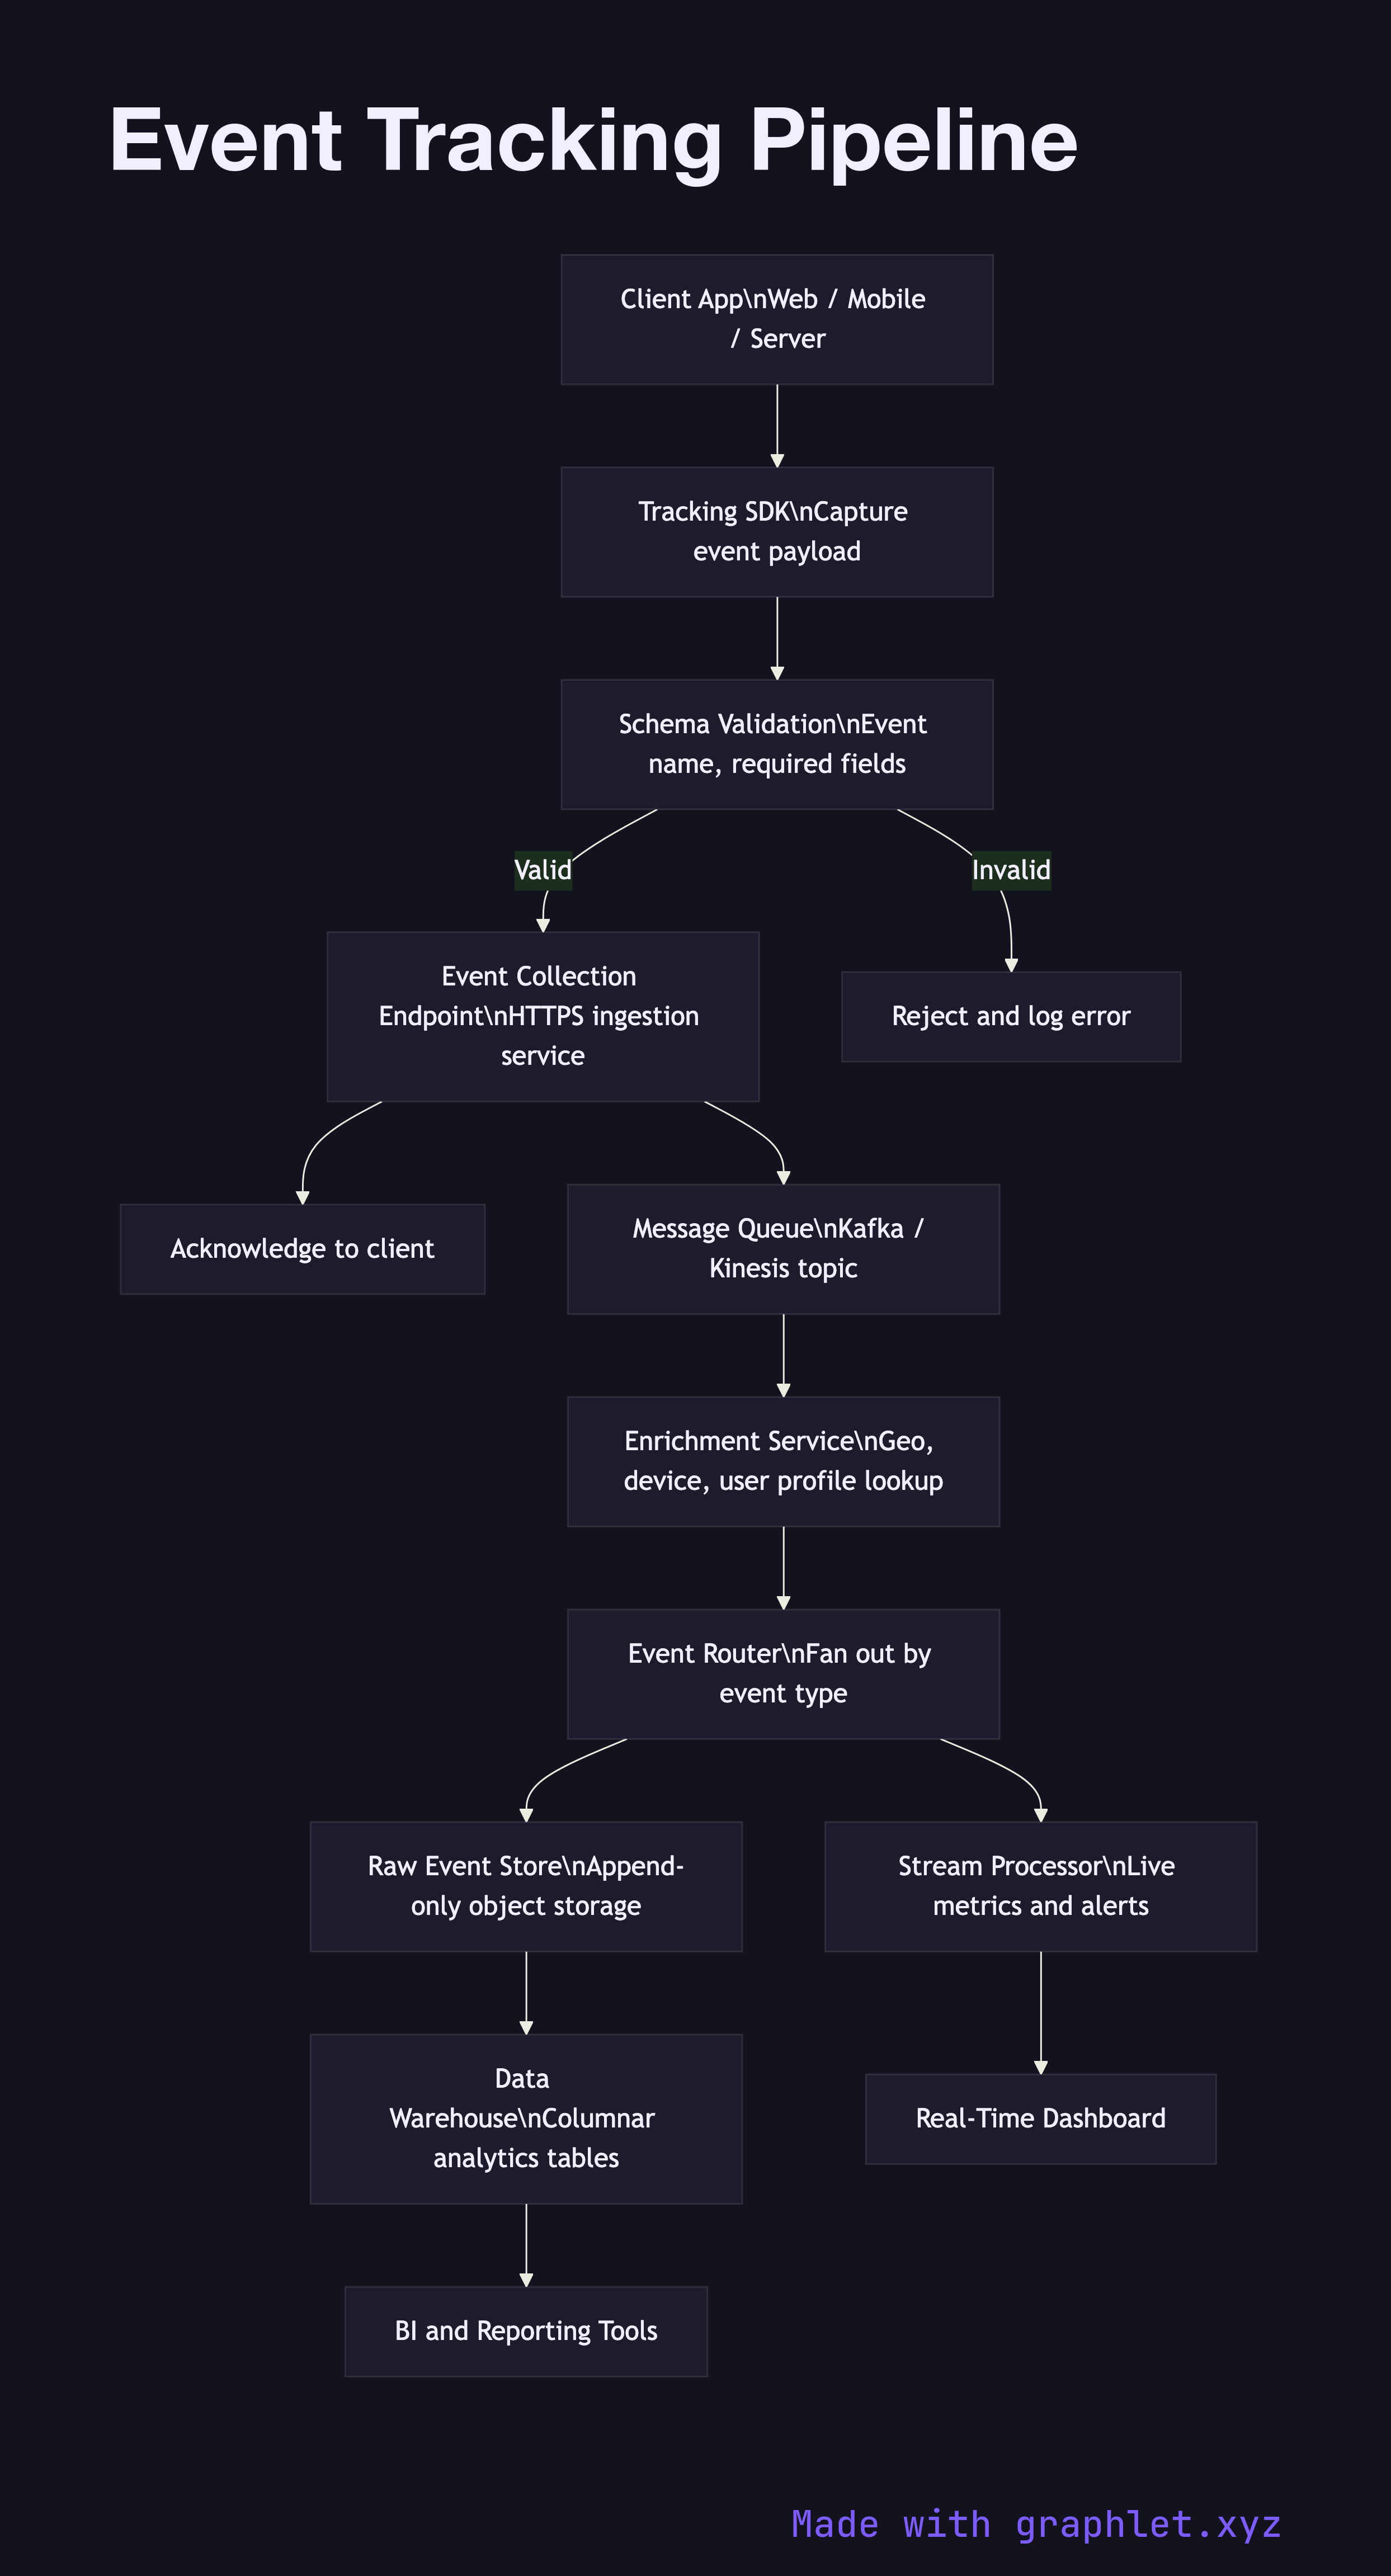
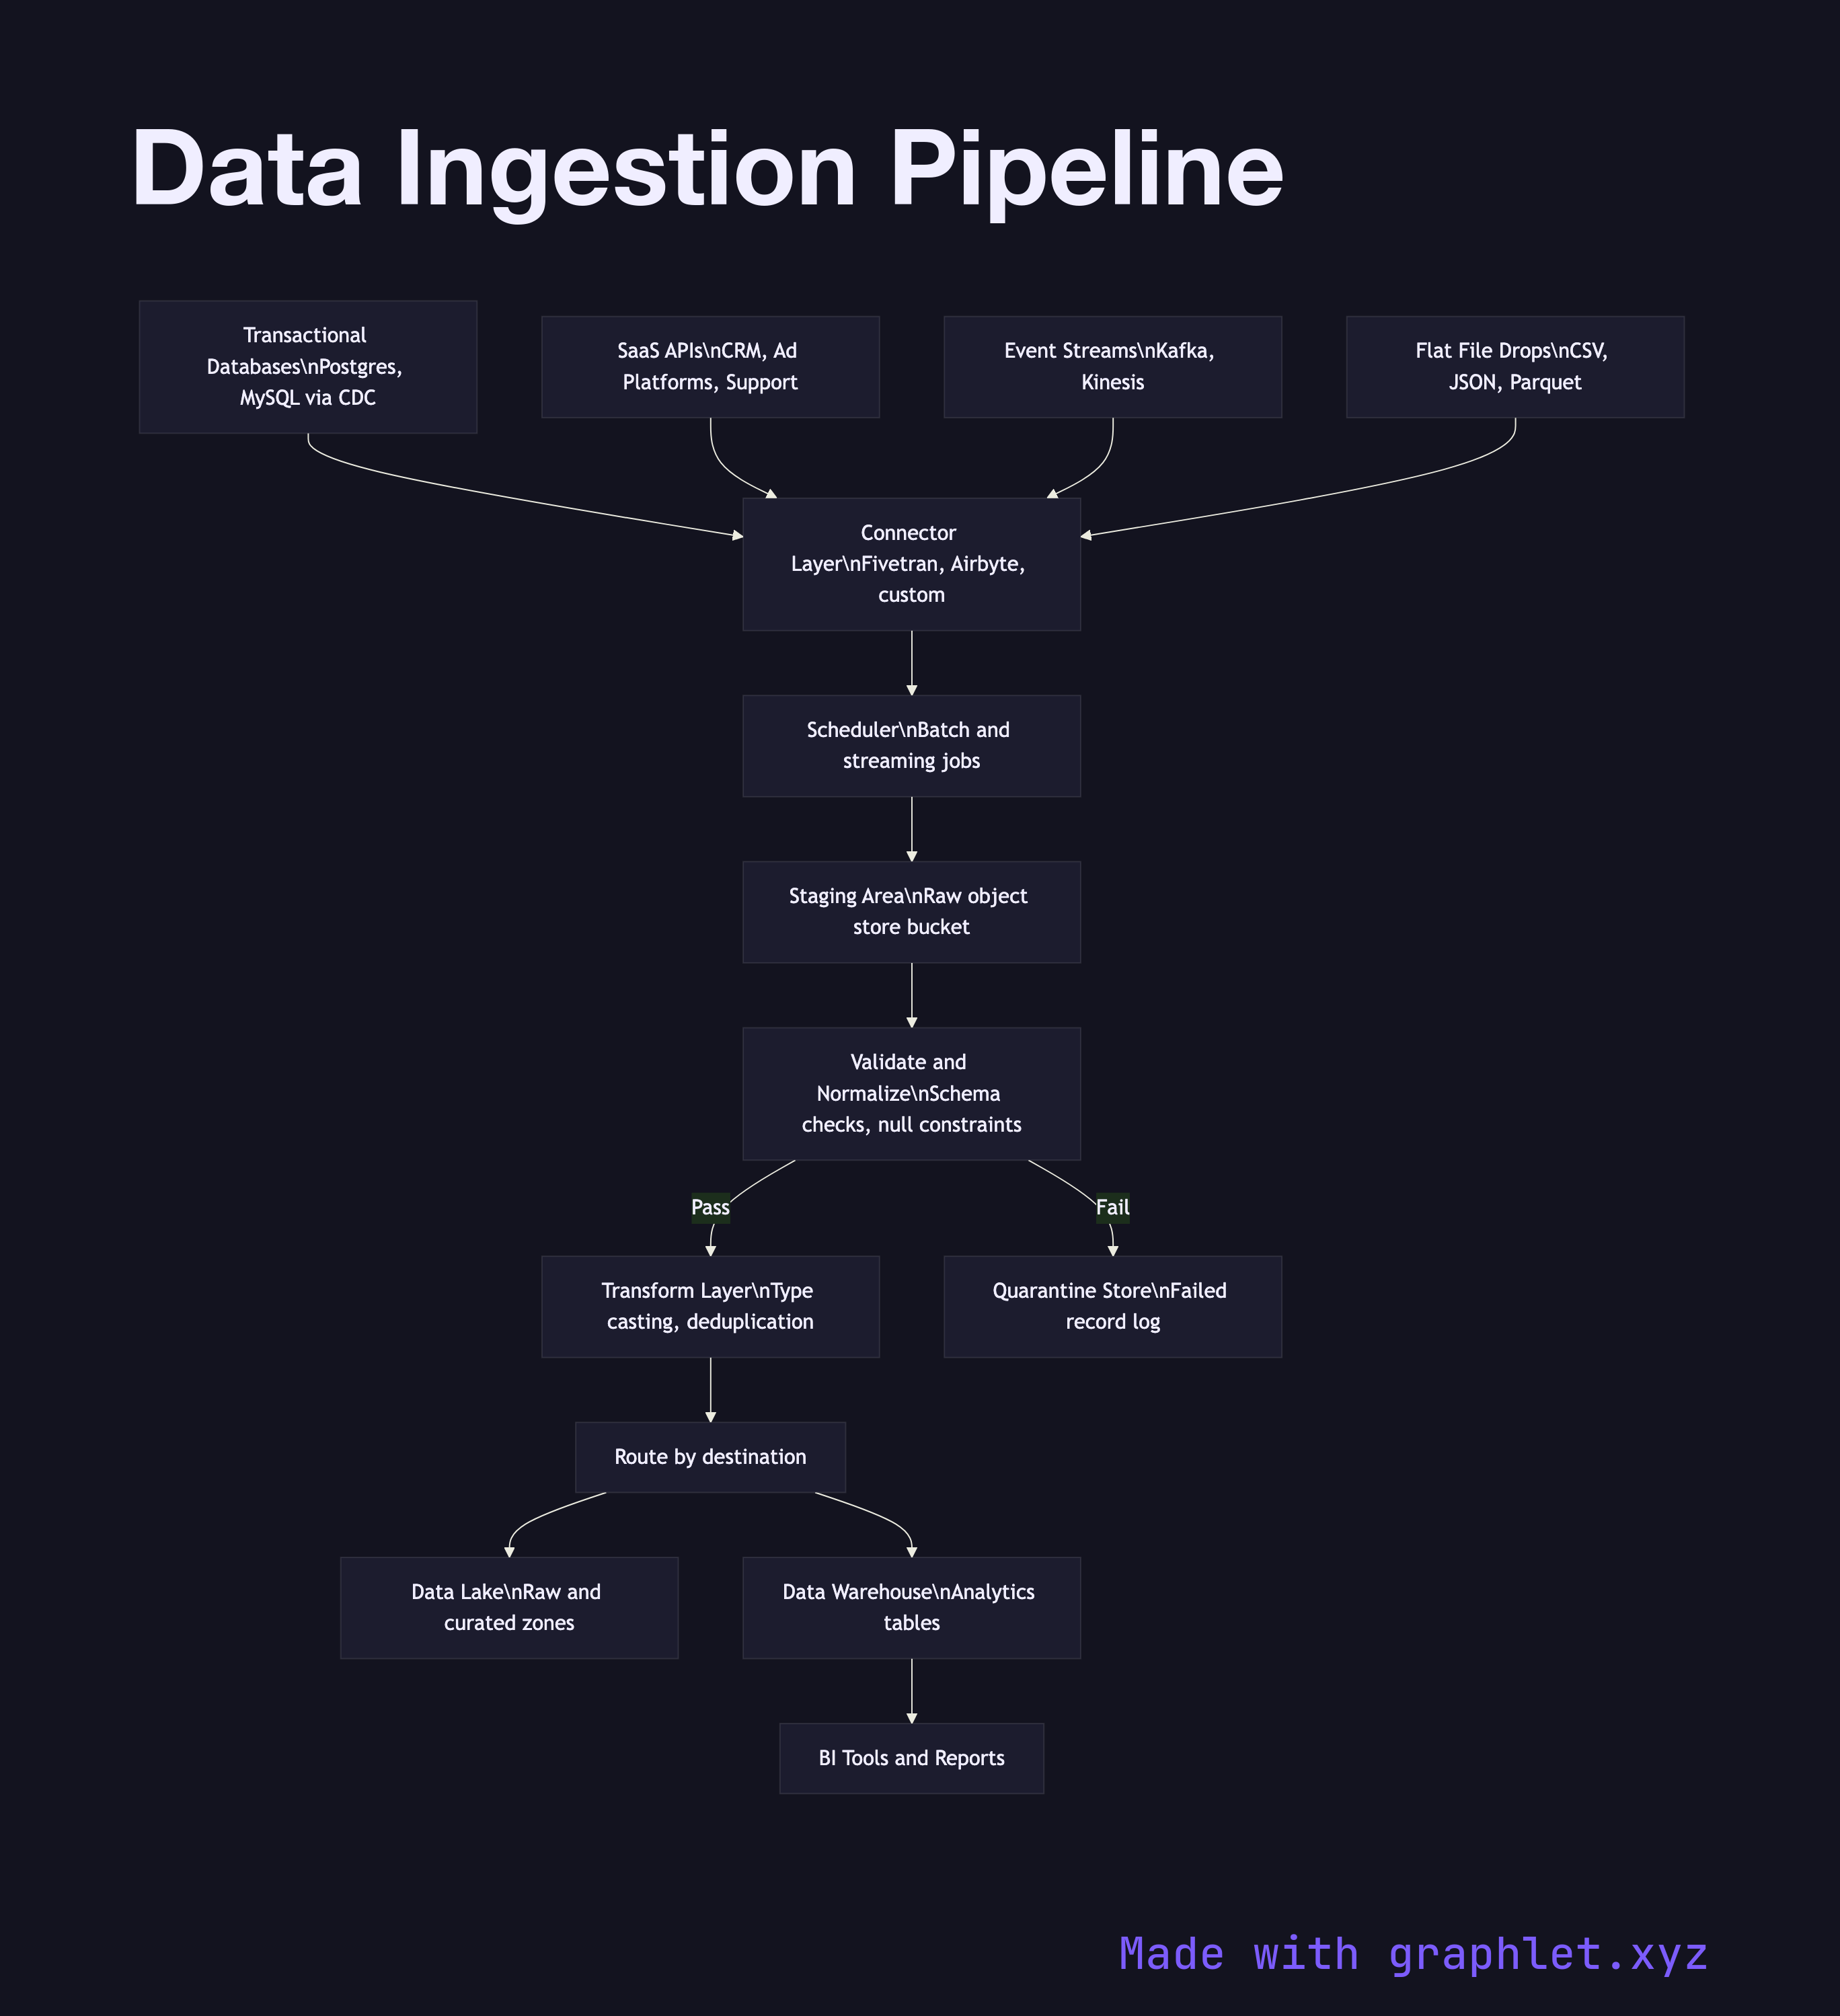
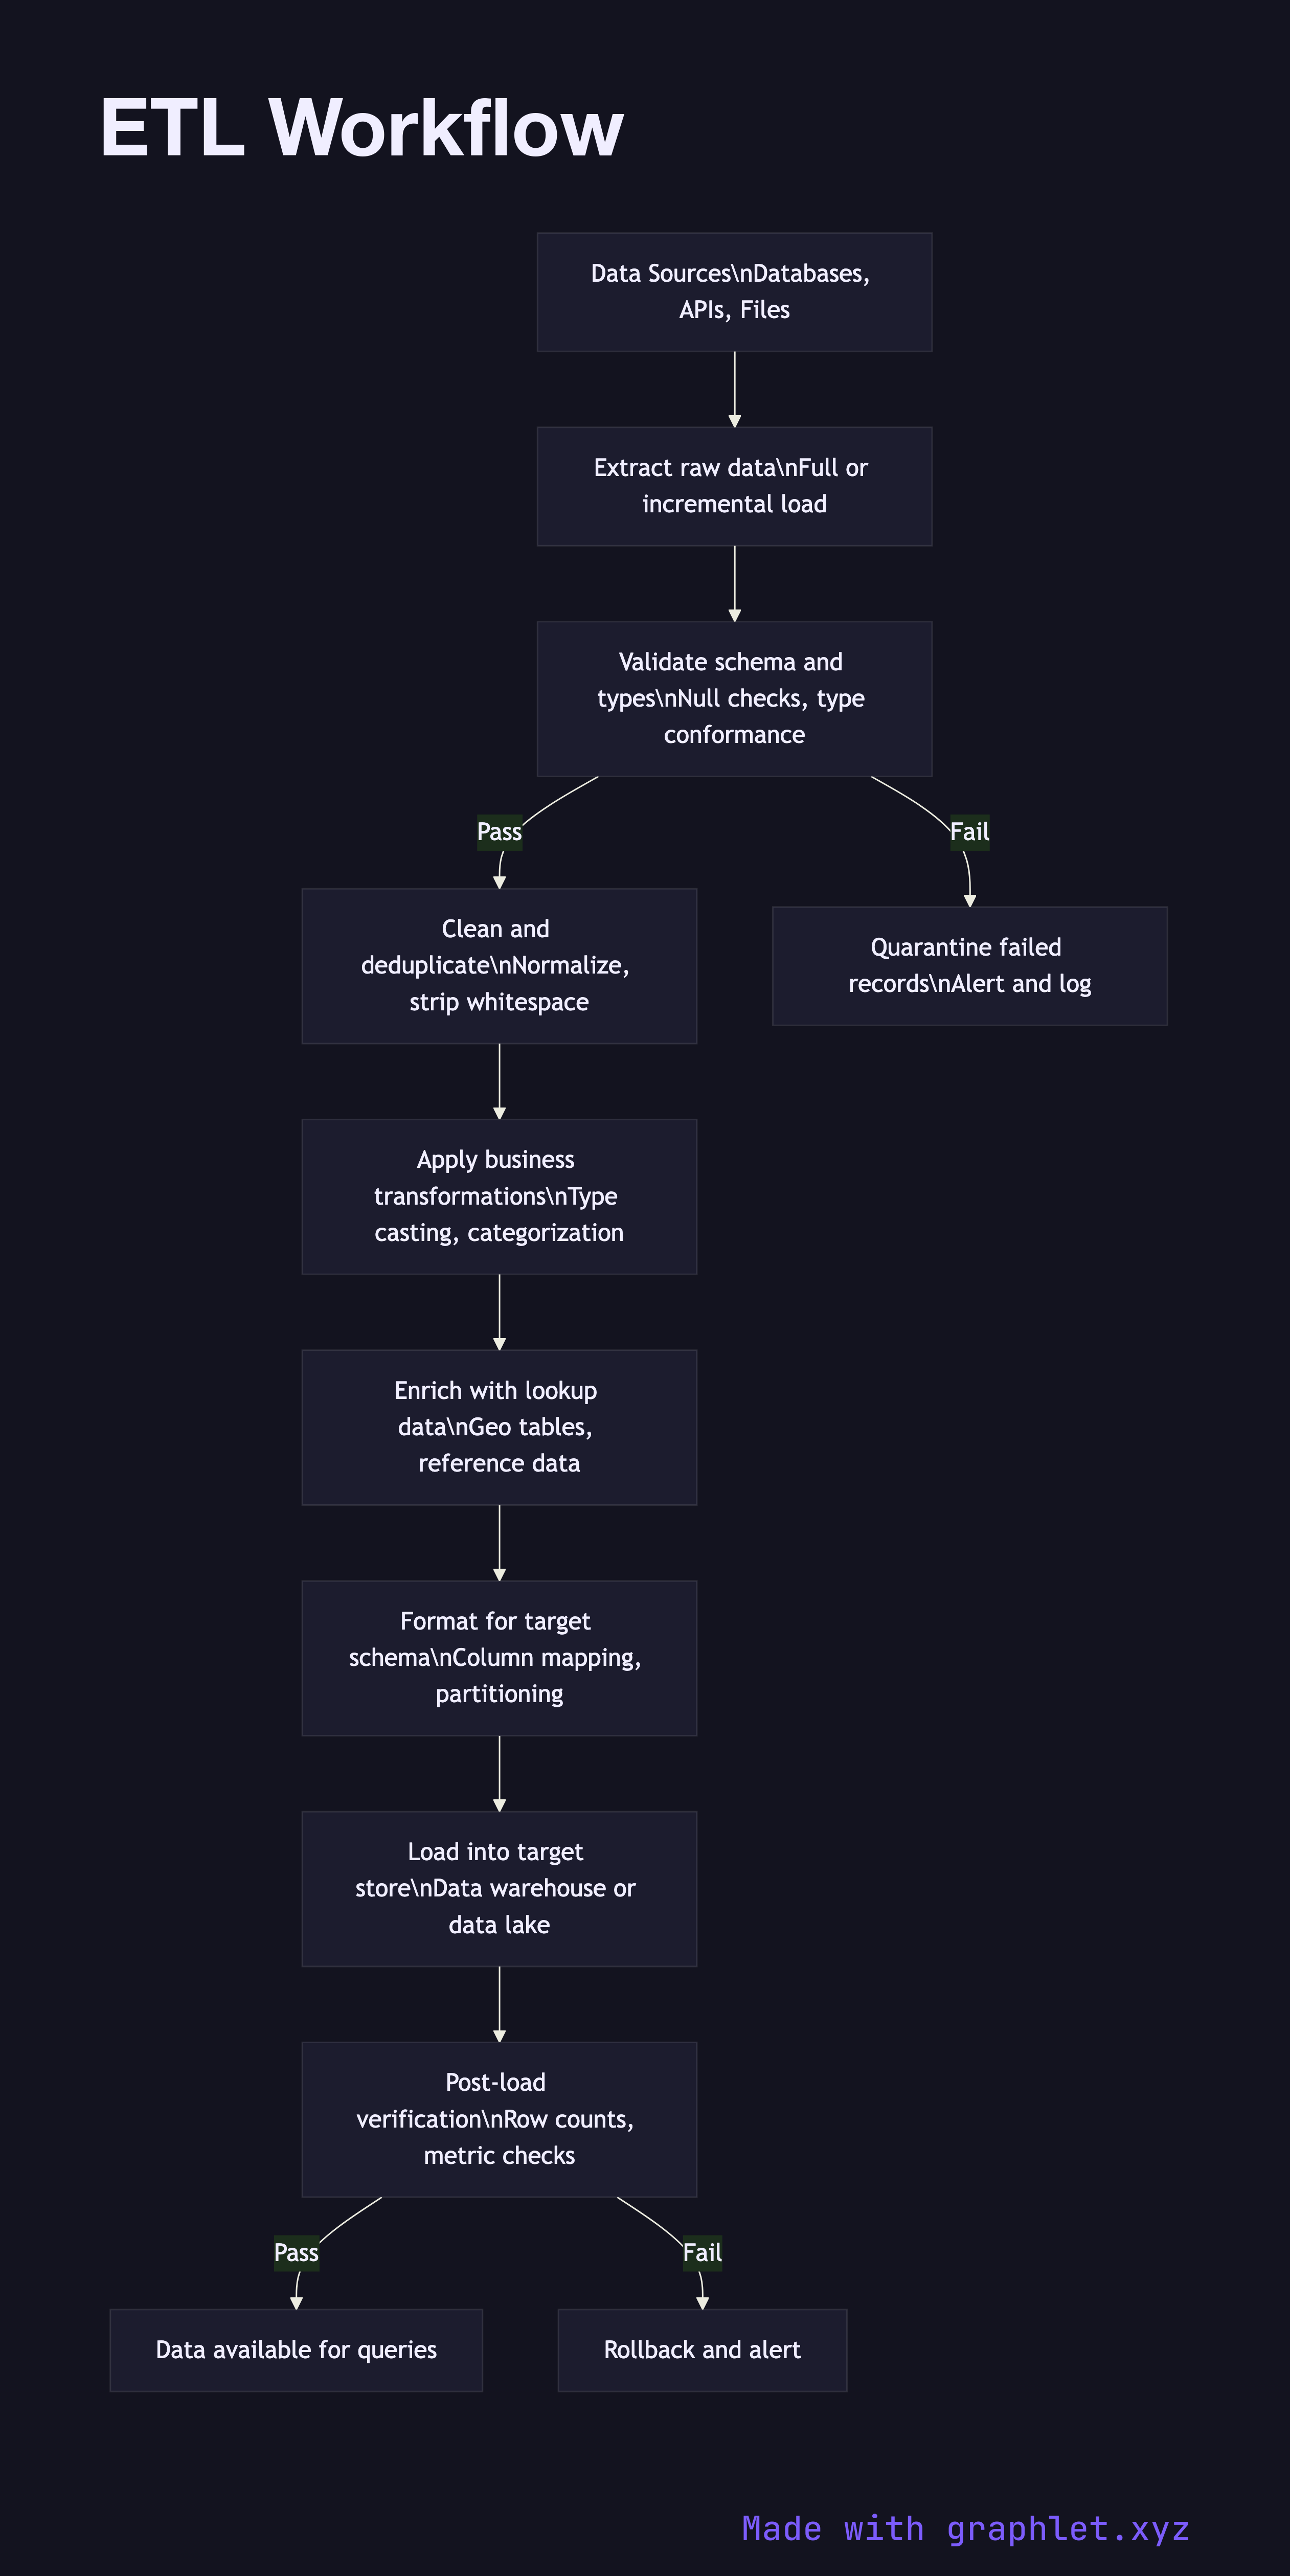
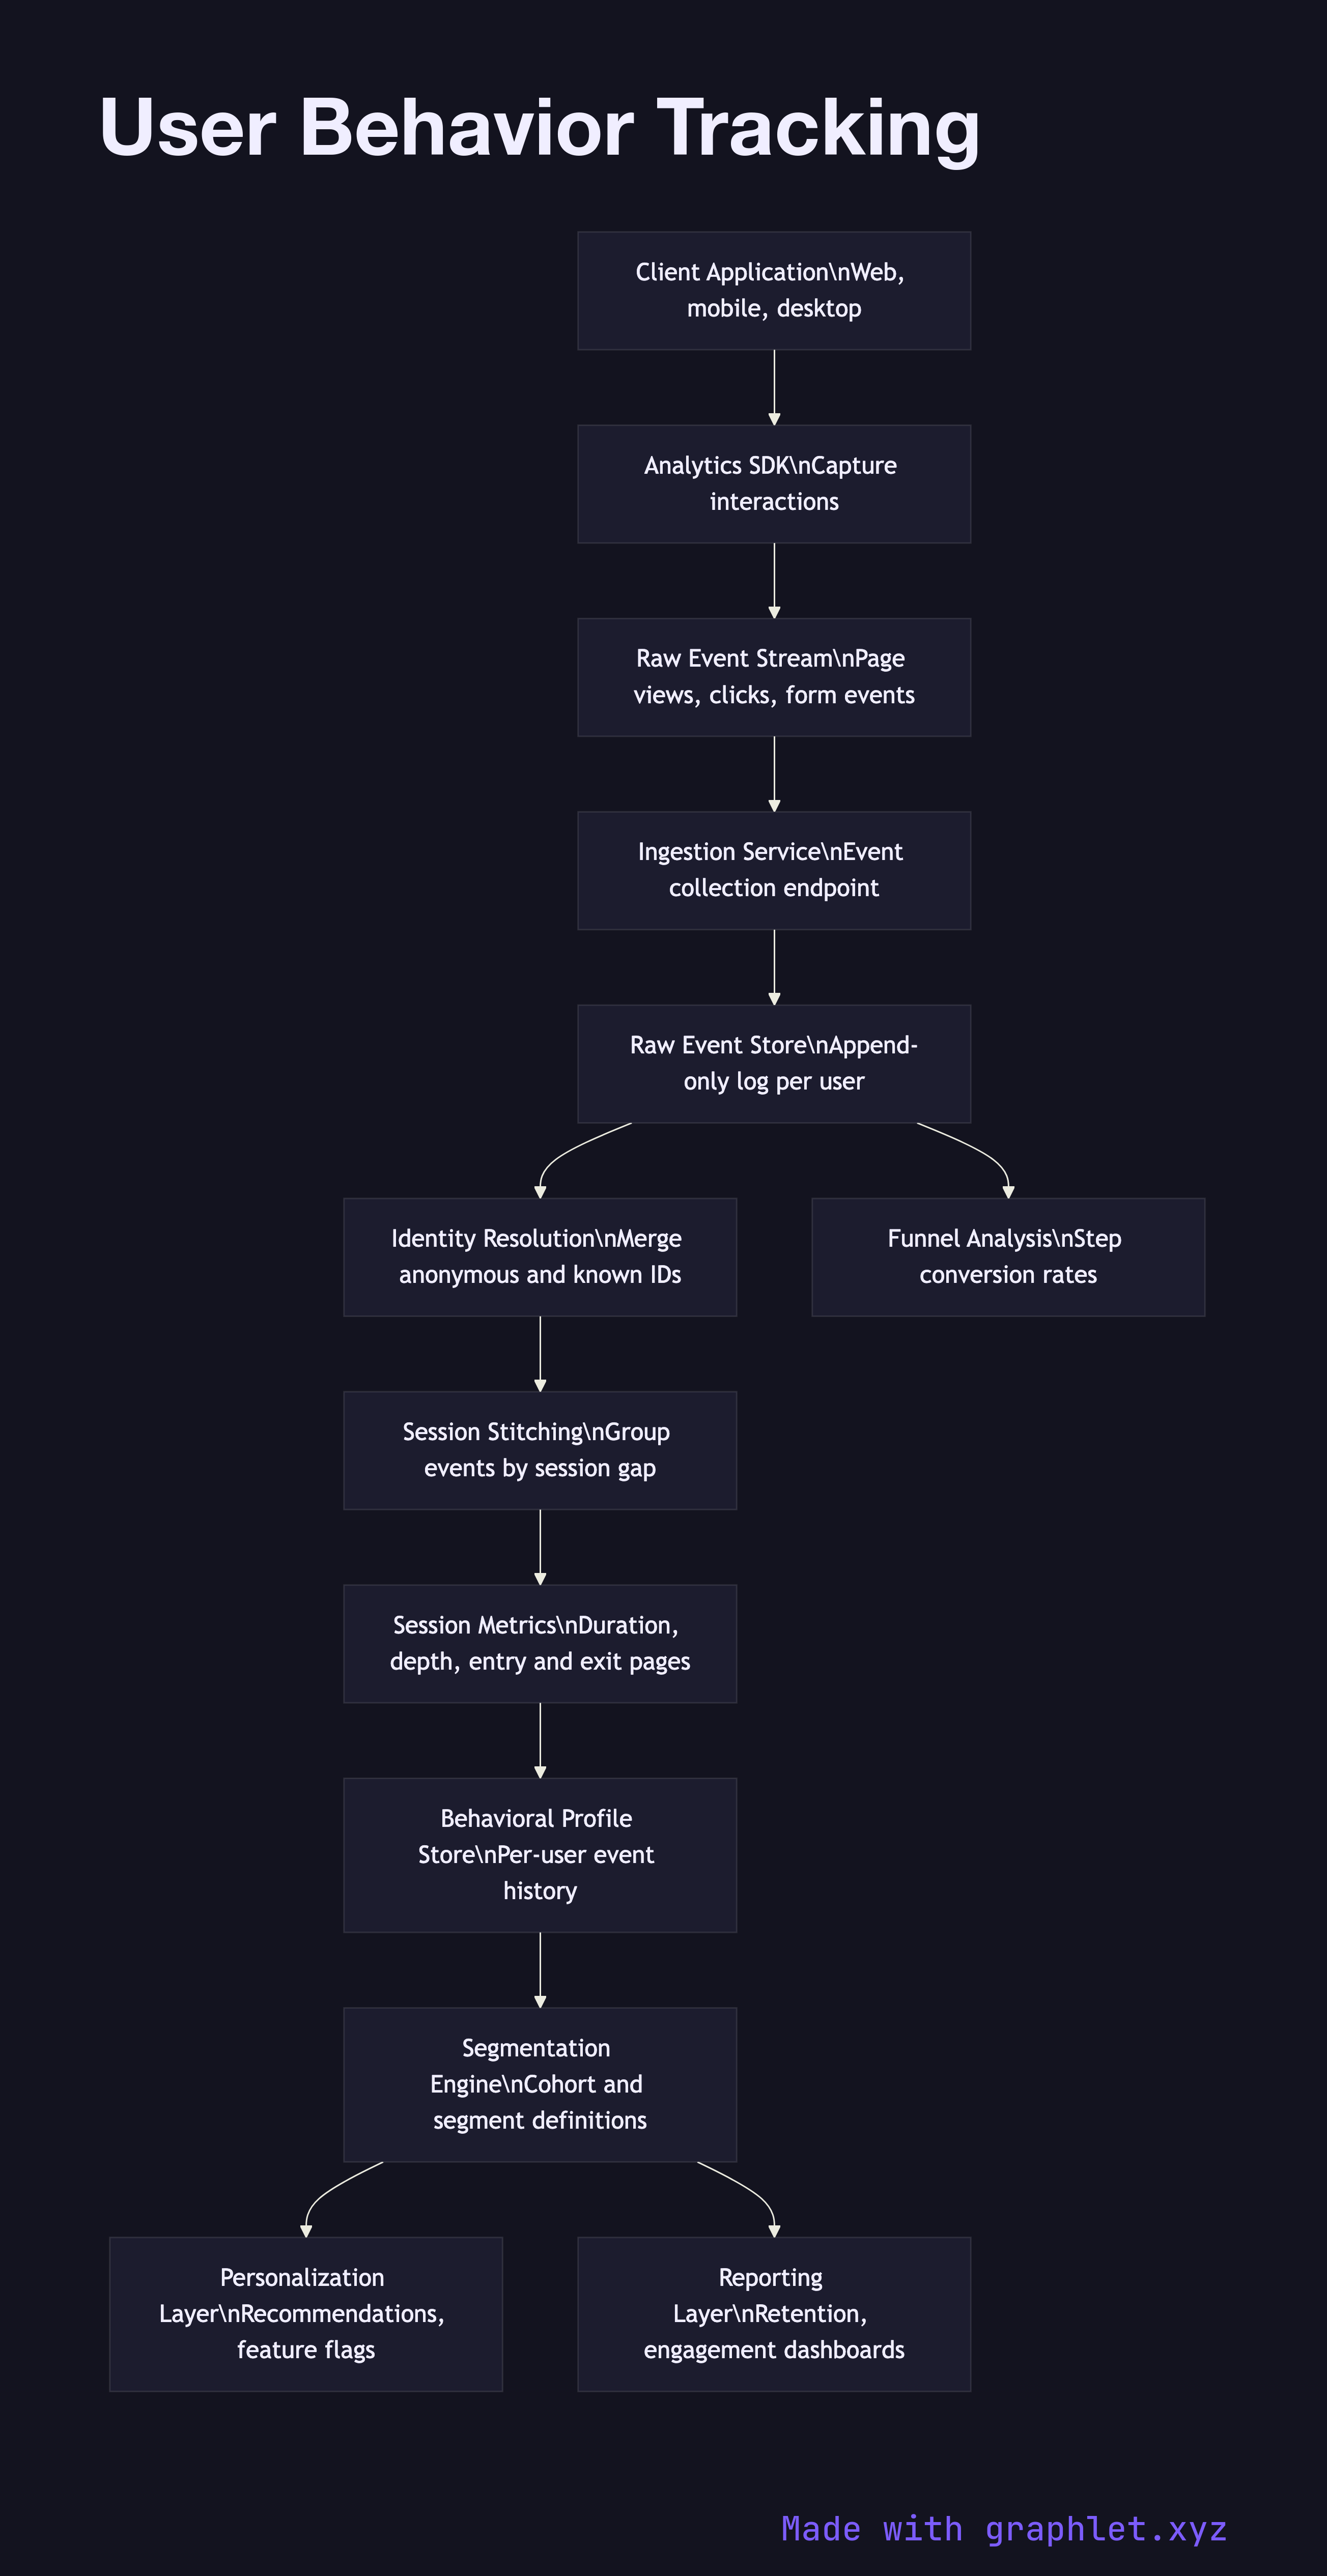
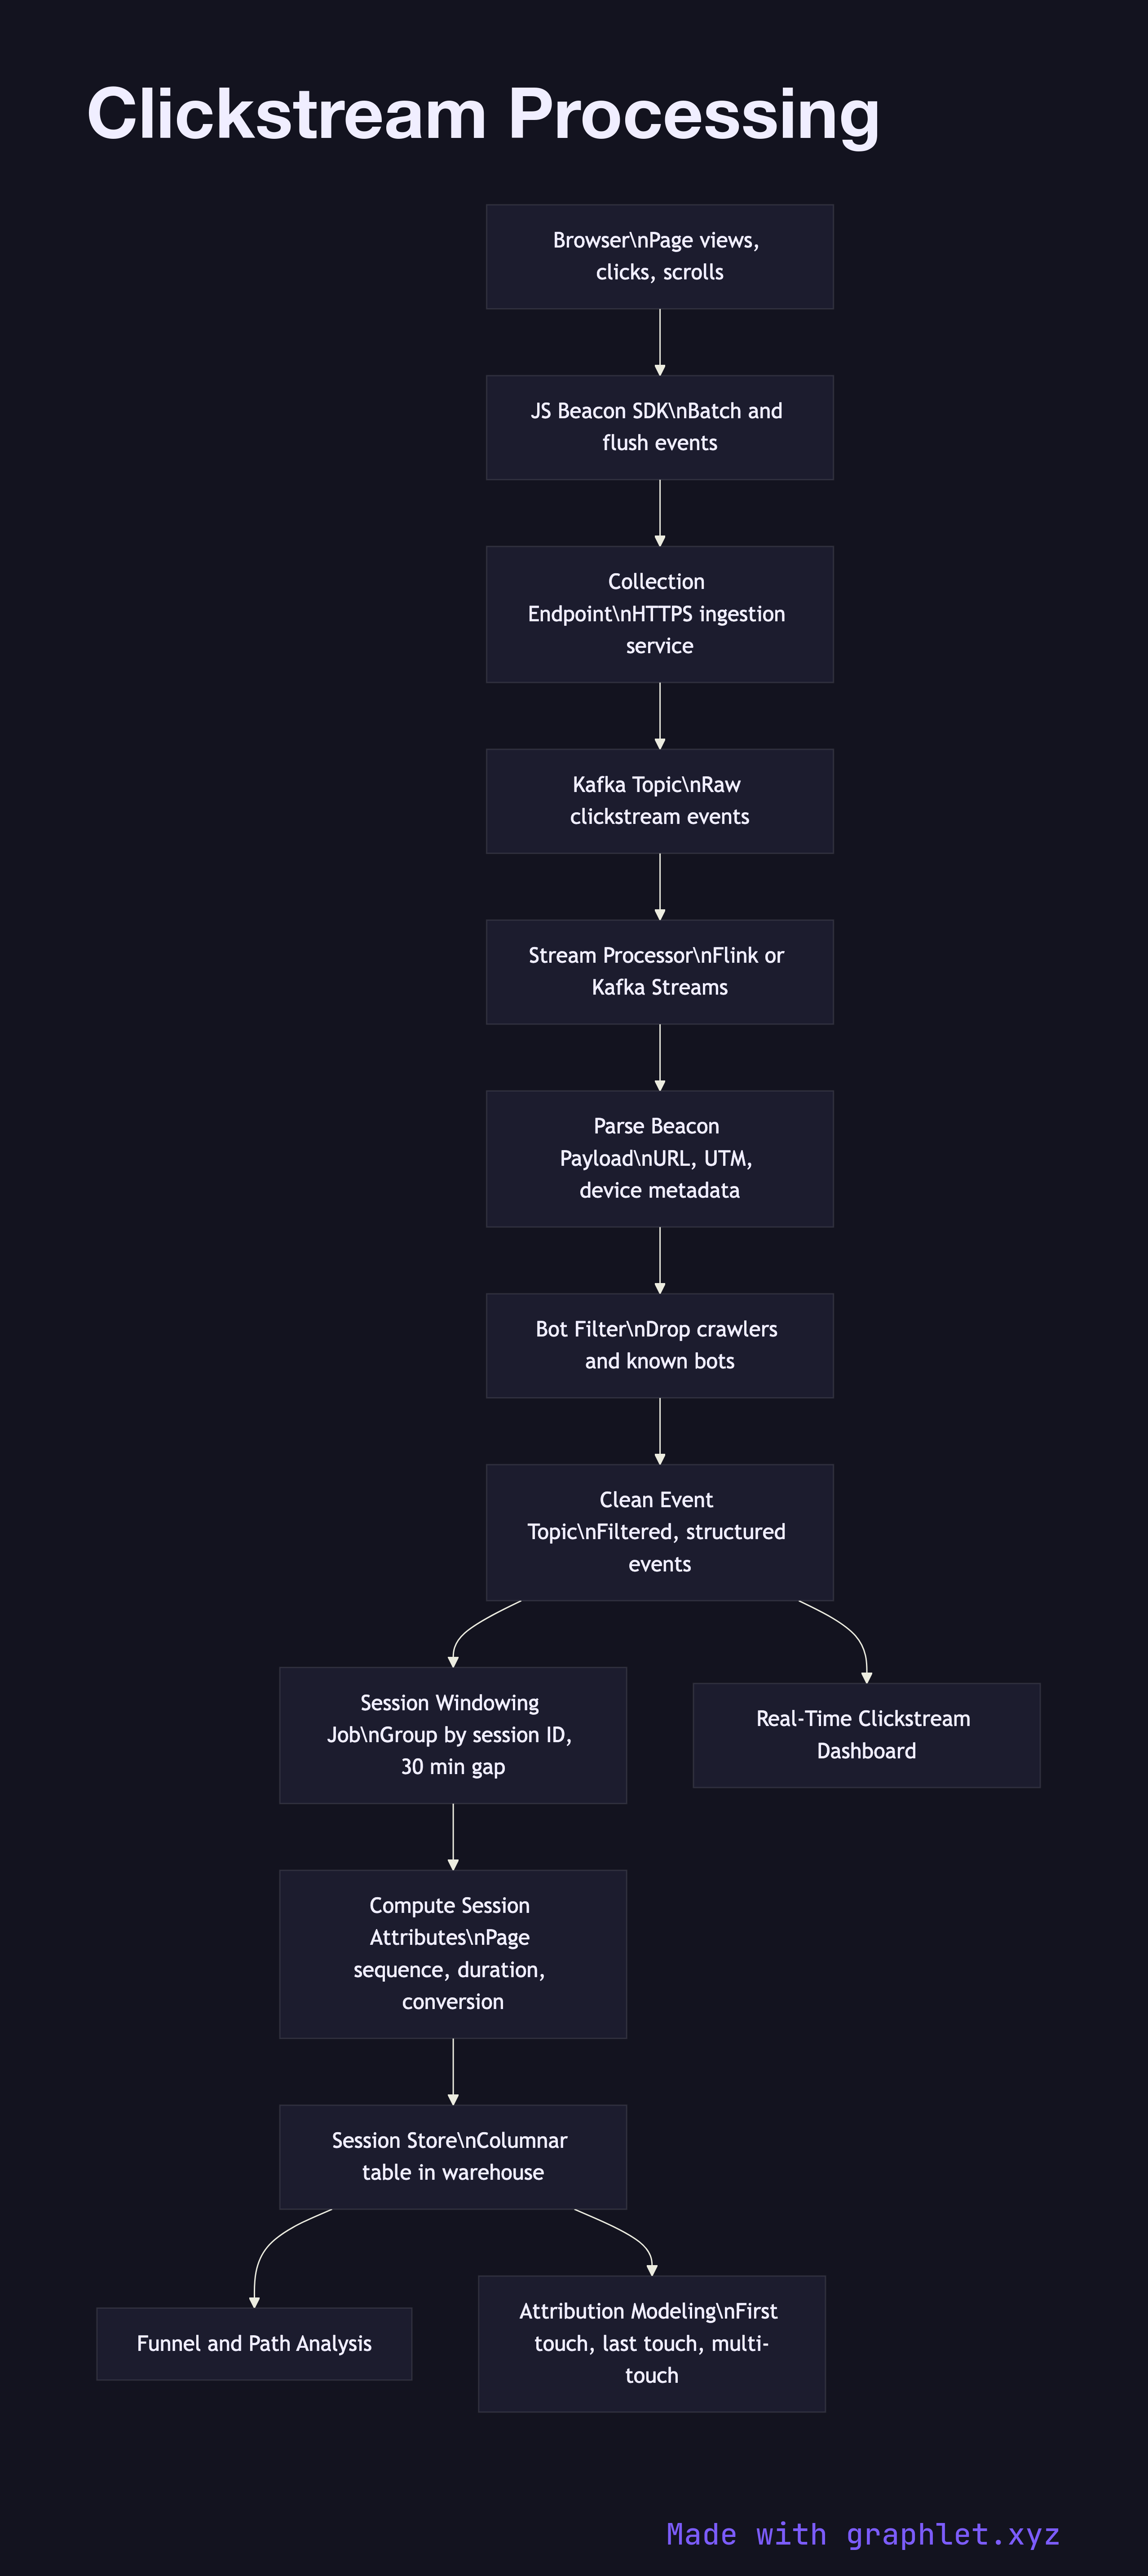
This collection covers the full analytics stack. The foundation starts with data collection: Event Tracking Pipeline shows how user actions are captured and routed from client applications, while User Behavior Tracking maps the journey from page interactions to a structured behavioral record. For bulk data movement, Data Ingestion Pipeline and ETL Workflow cover the extract-transform-load cycle that feeds structured stores. Clickstream Processing digs into high-volume session data.
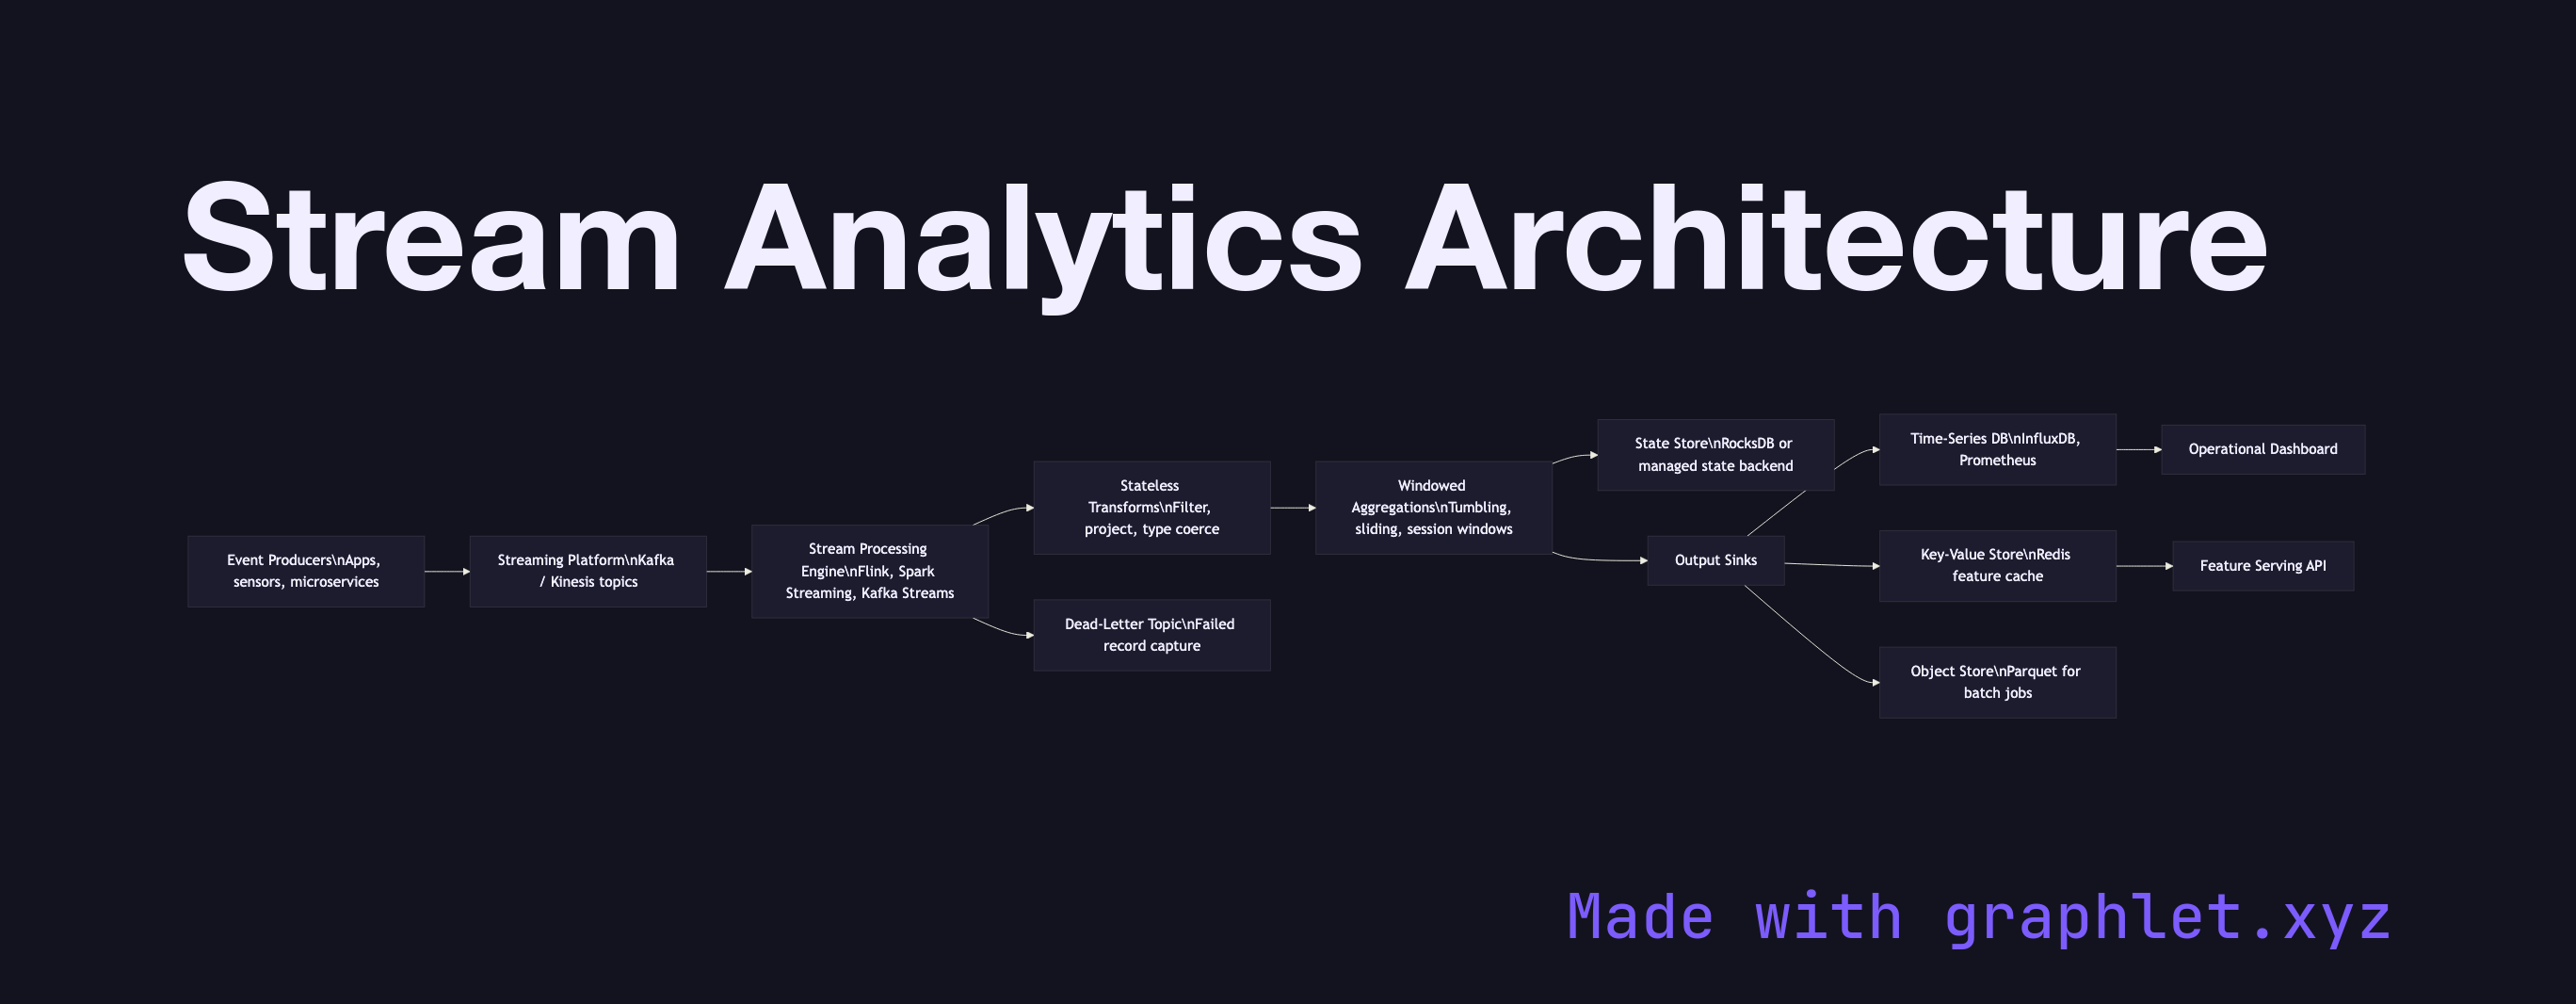
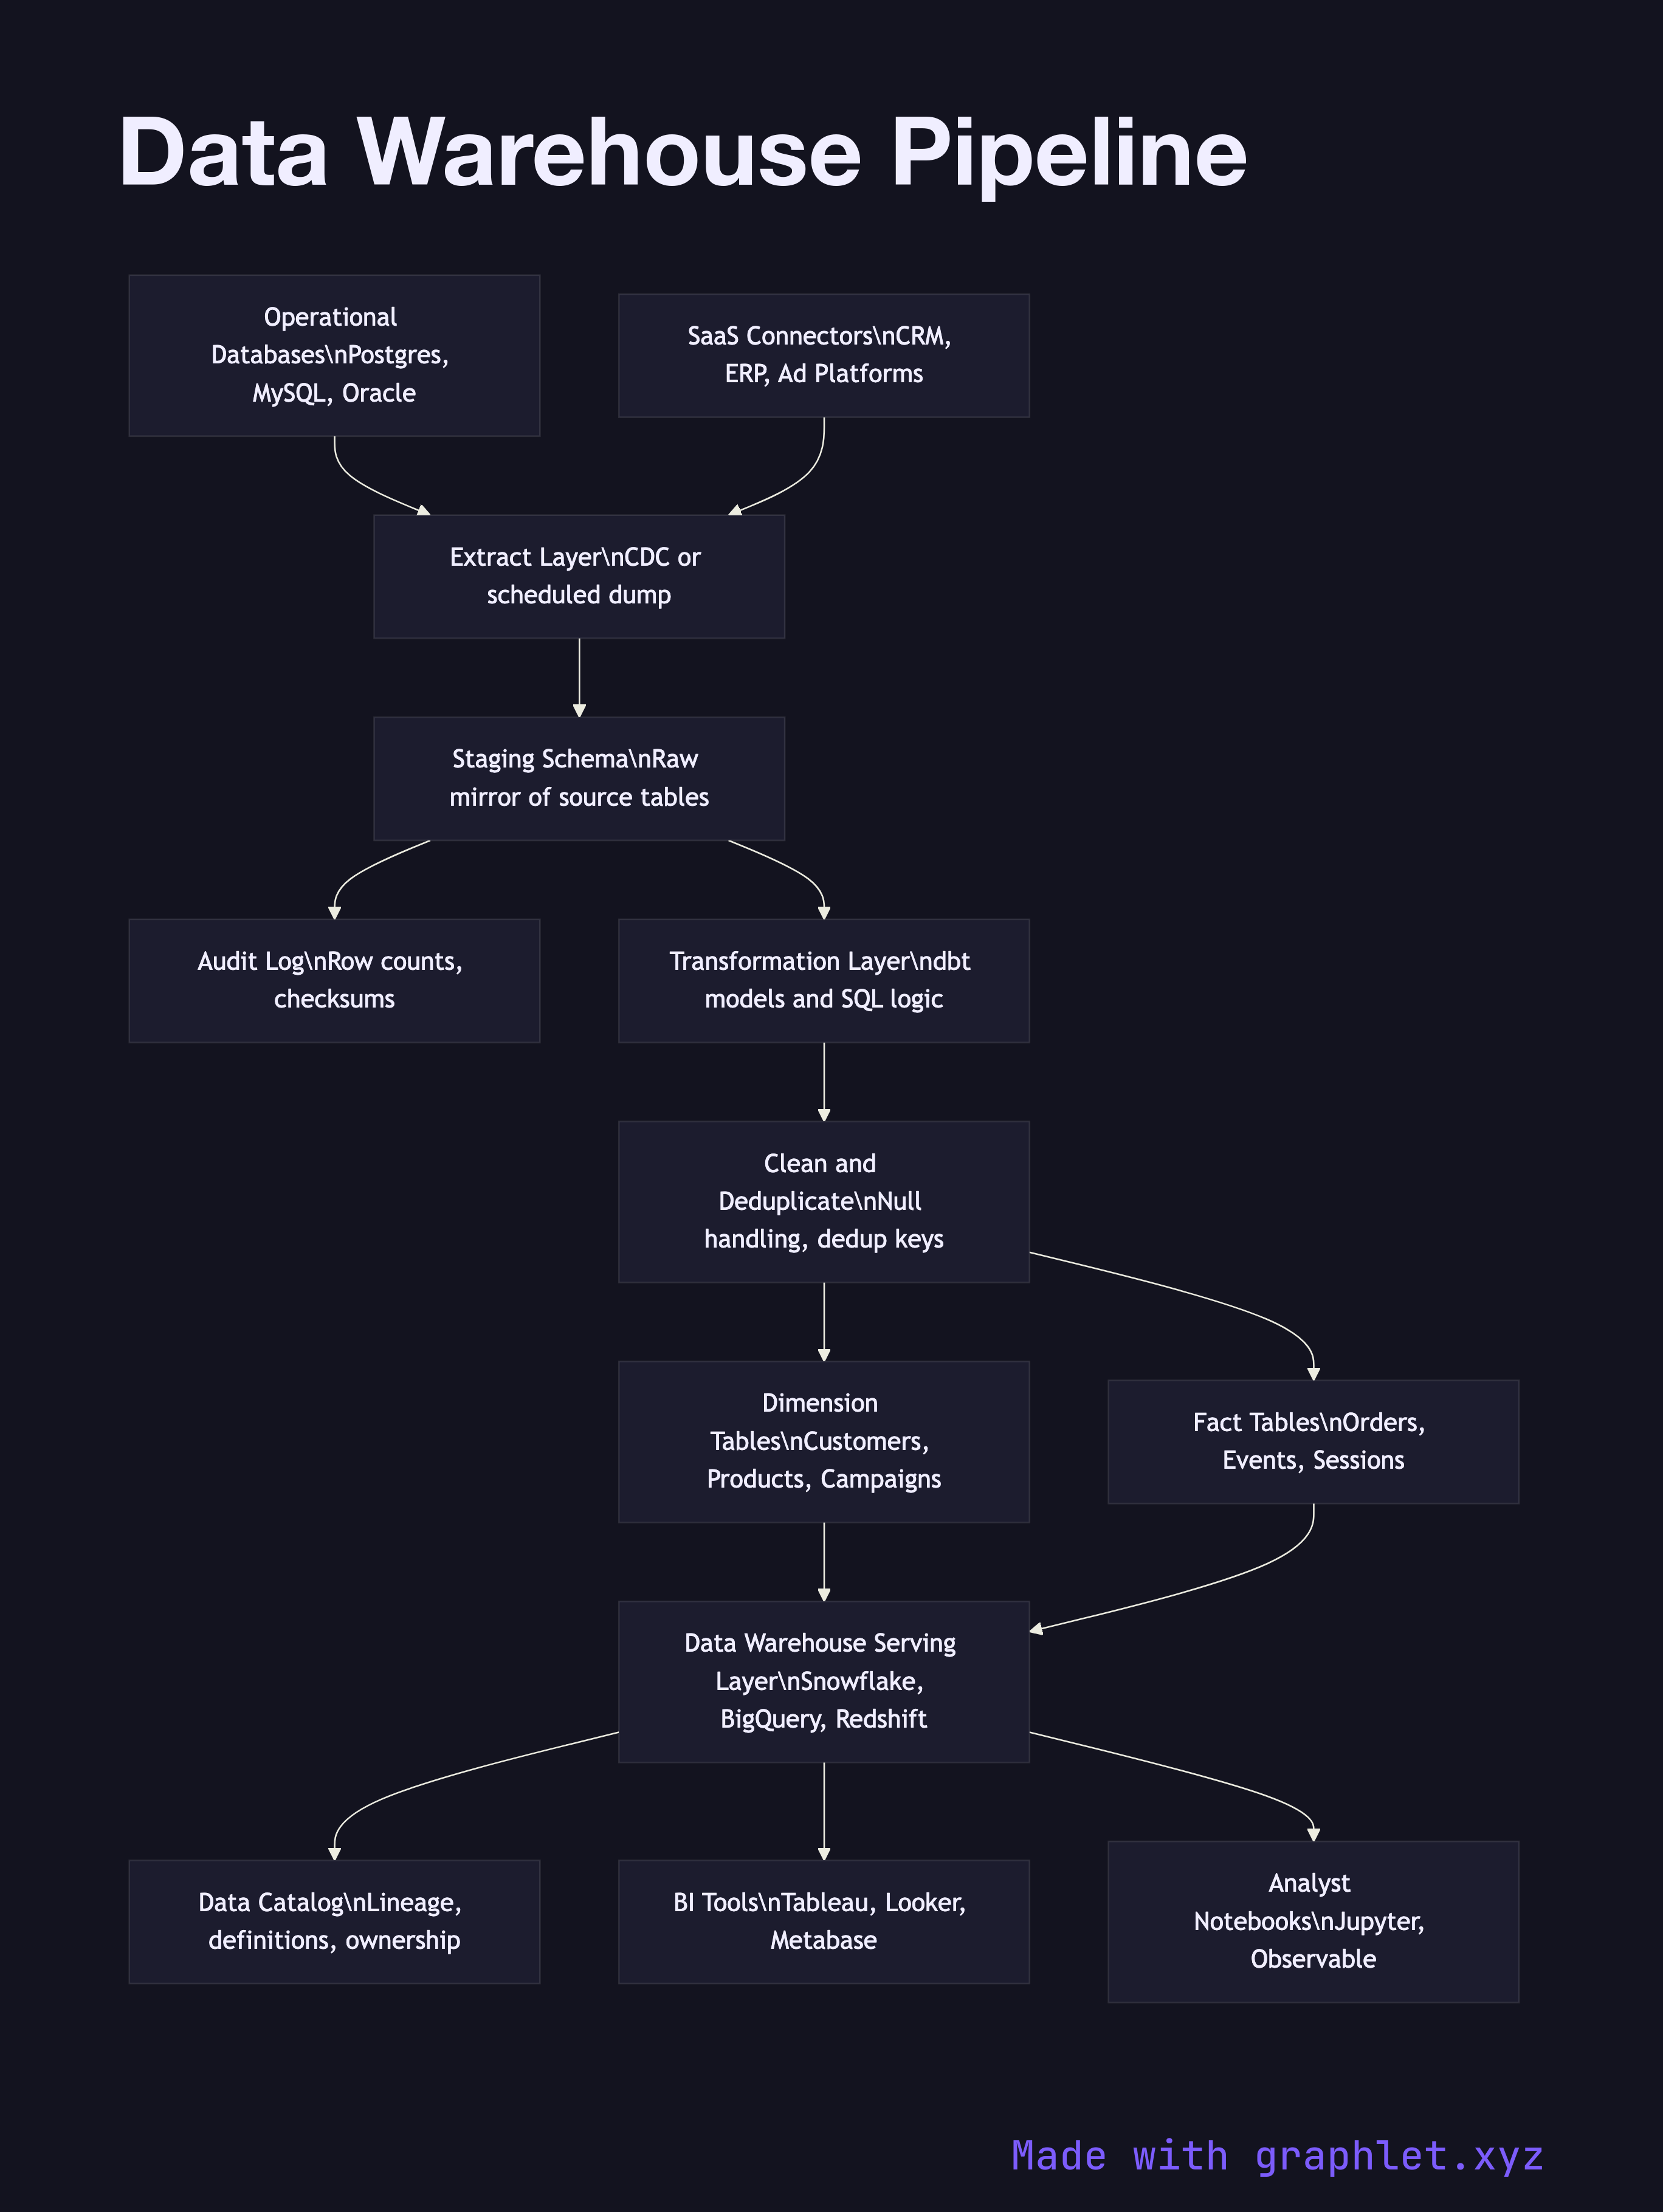
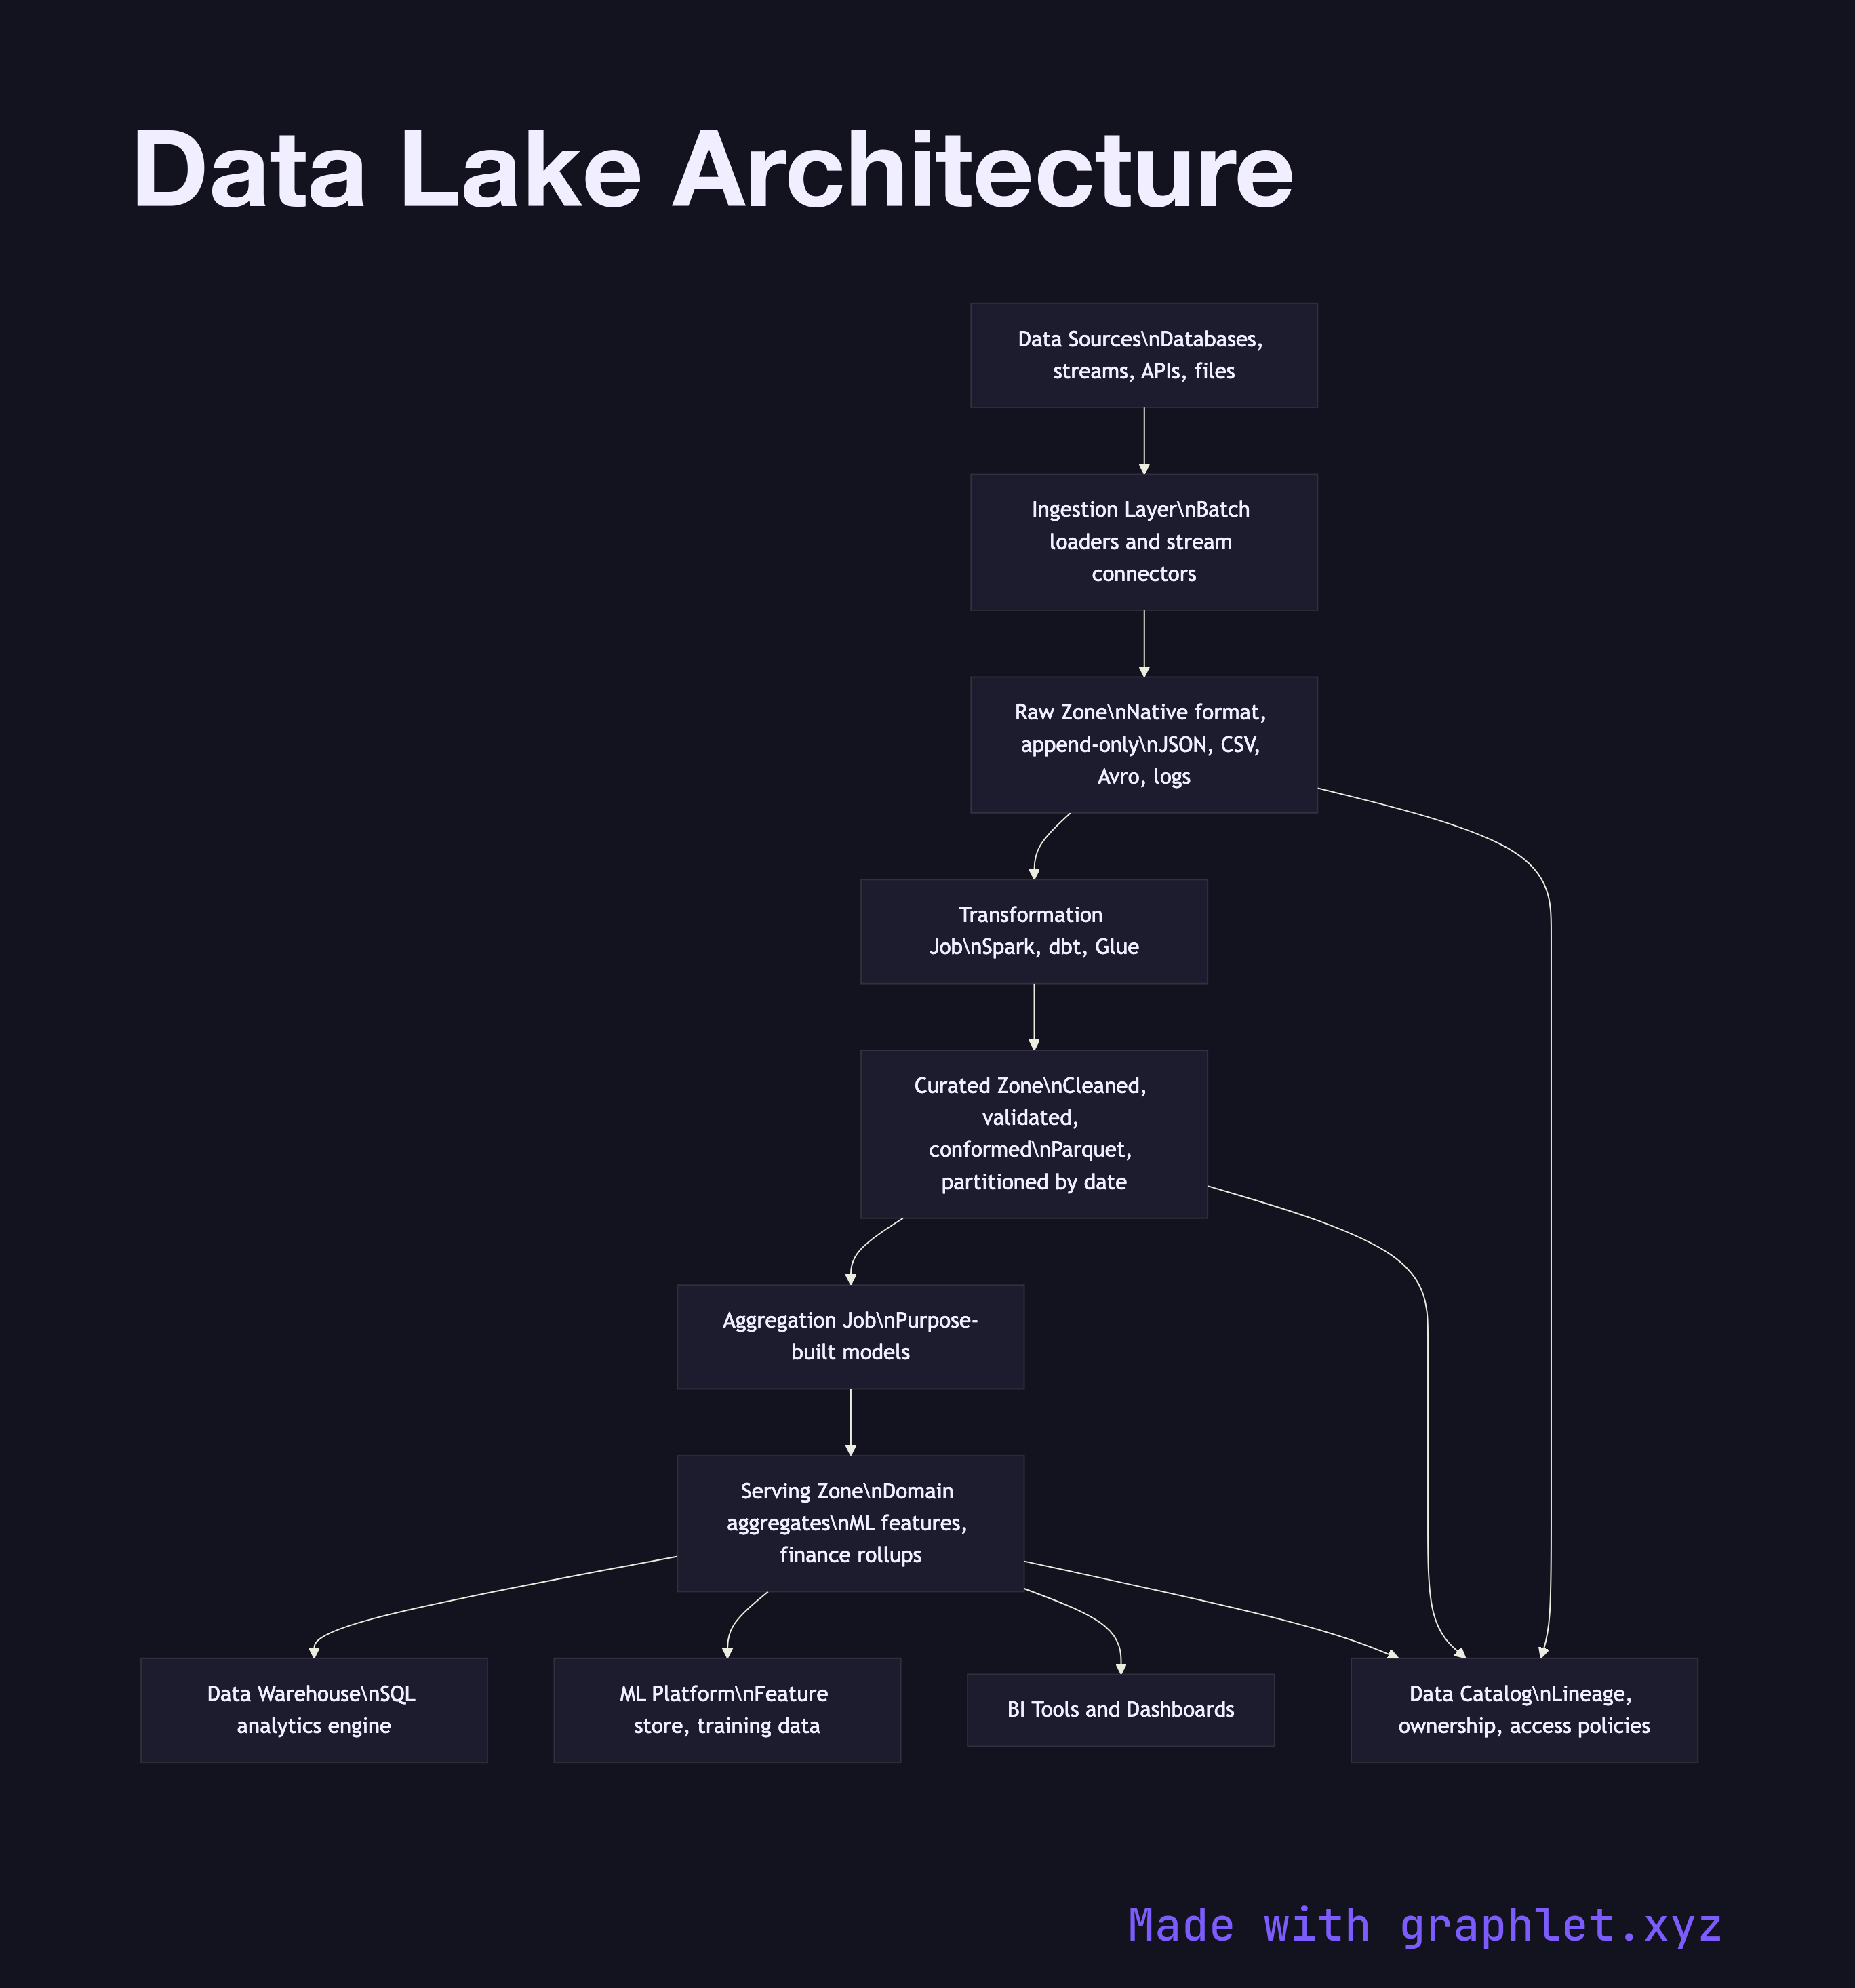
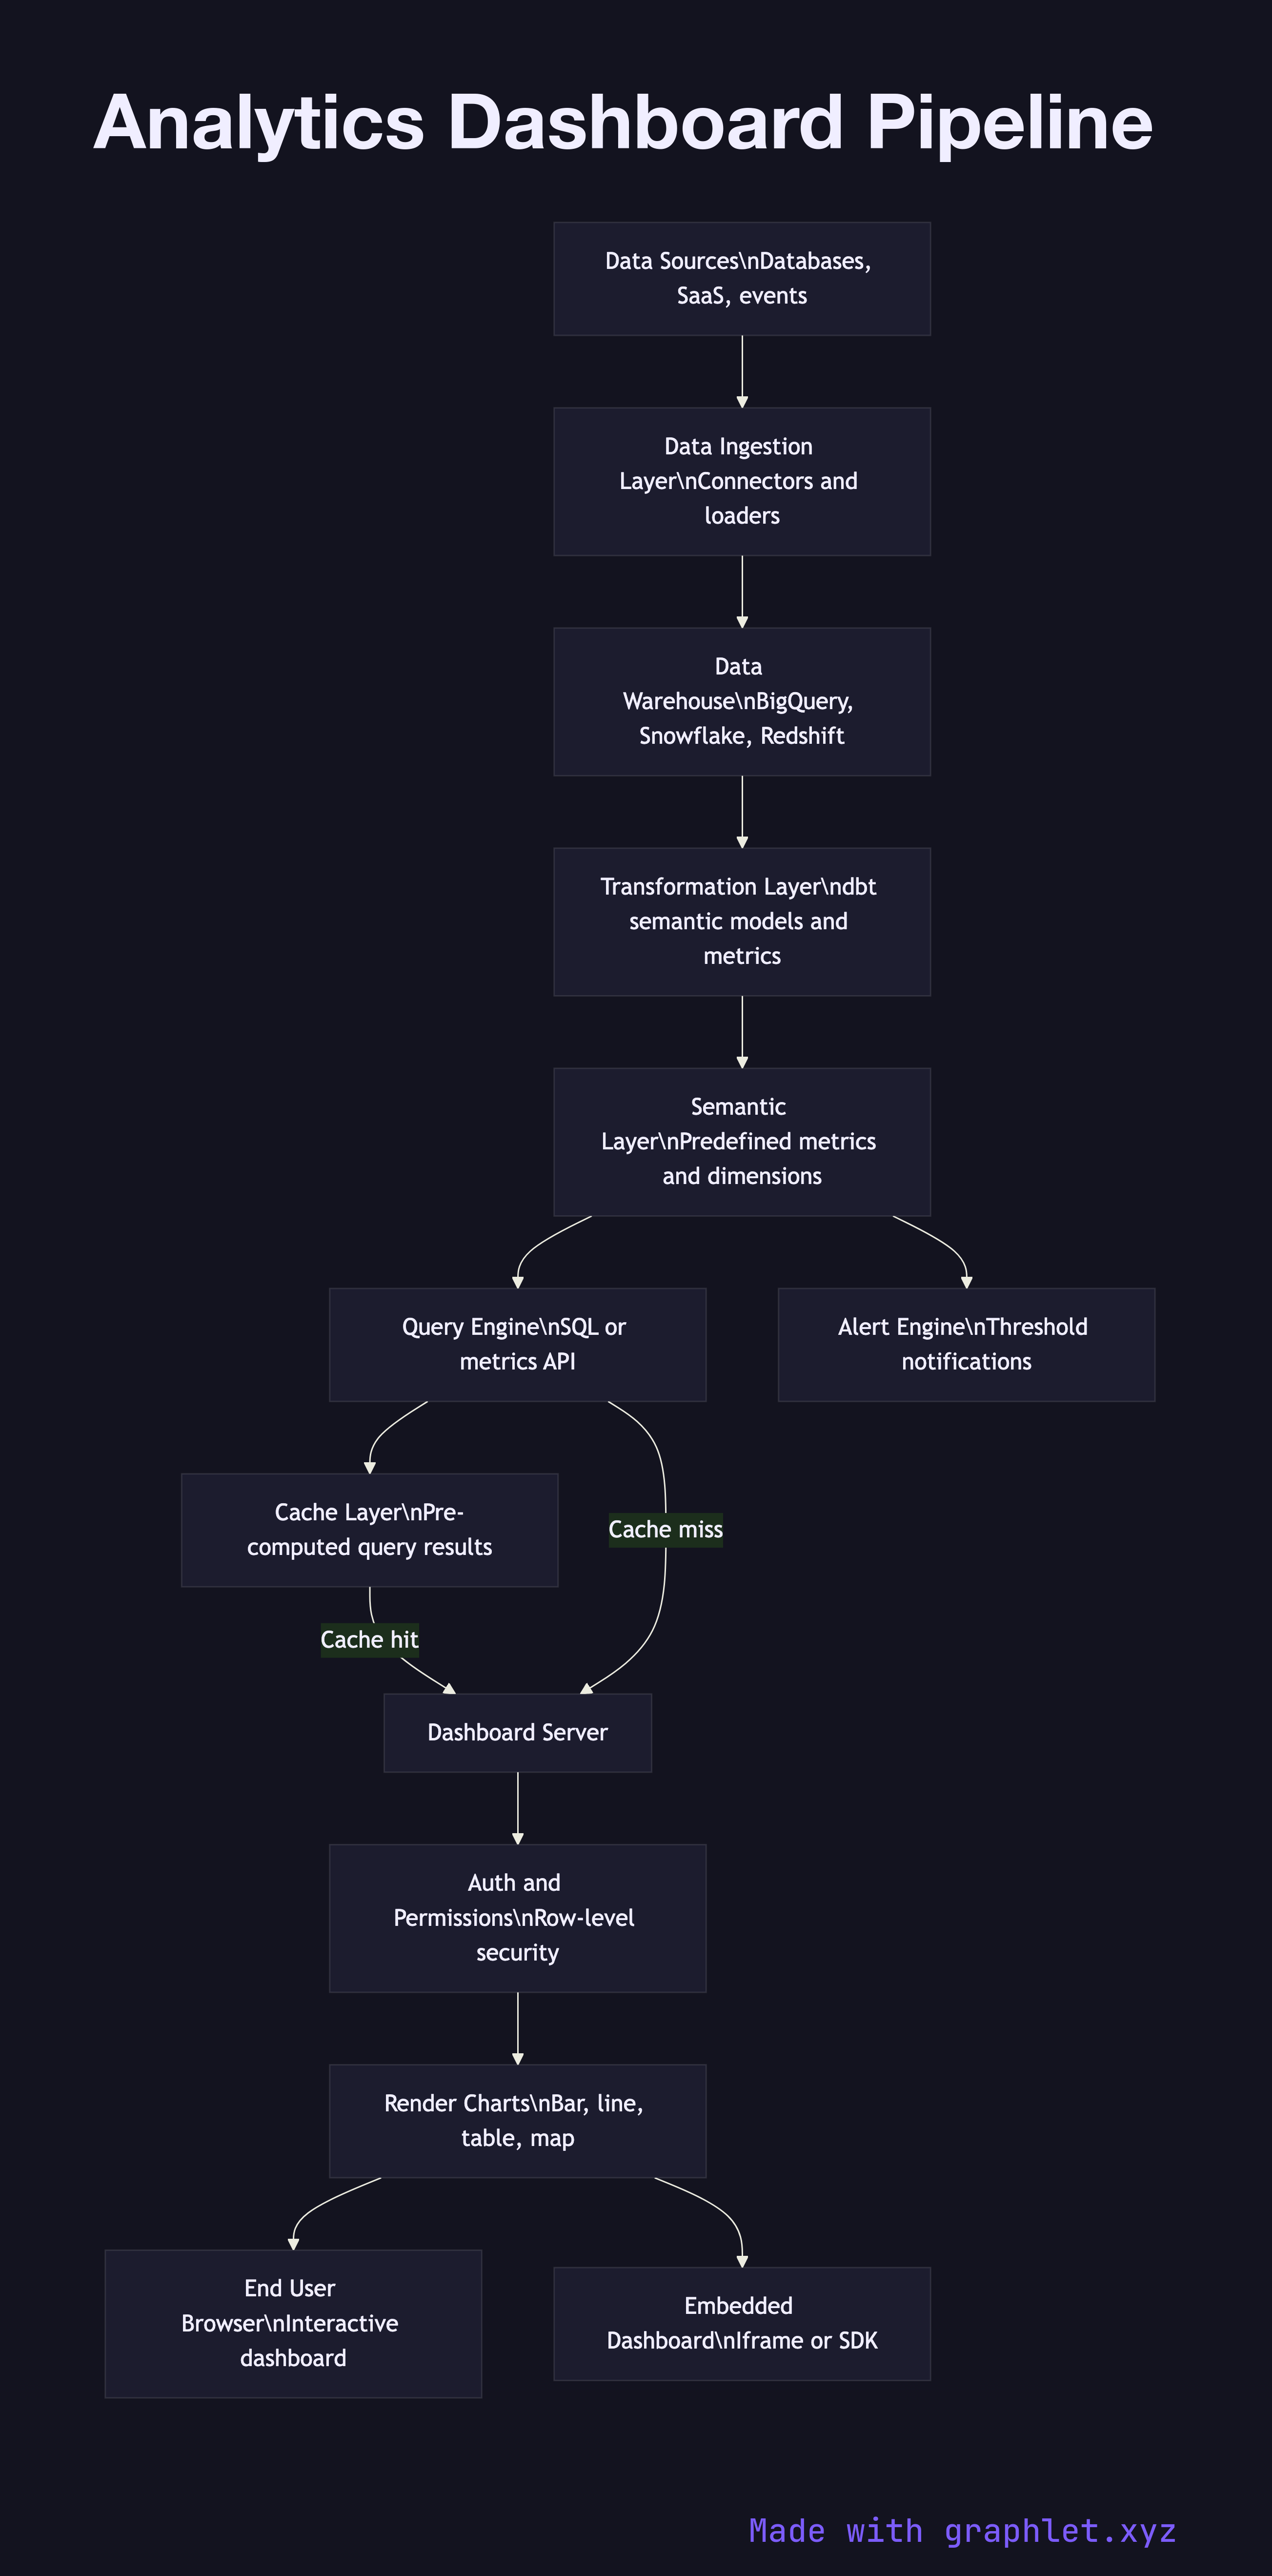
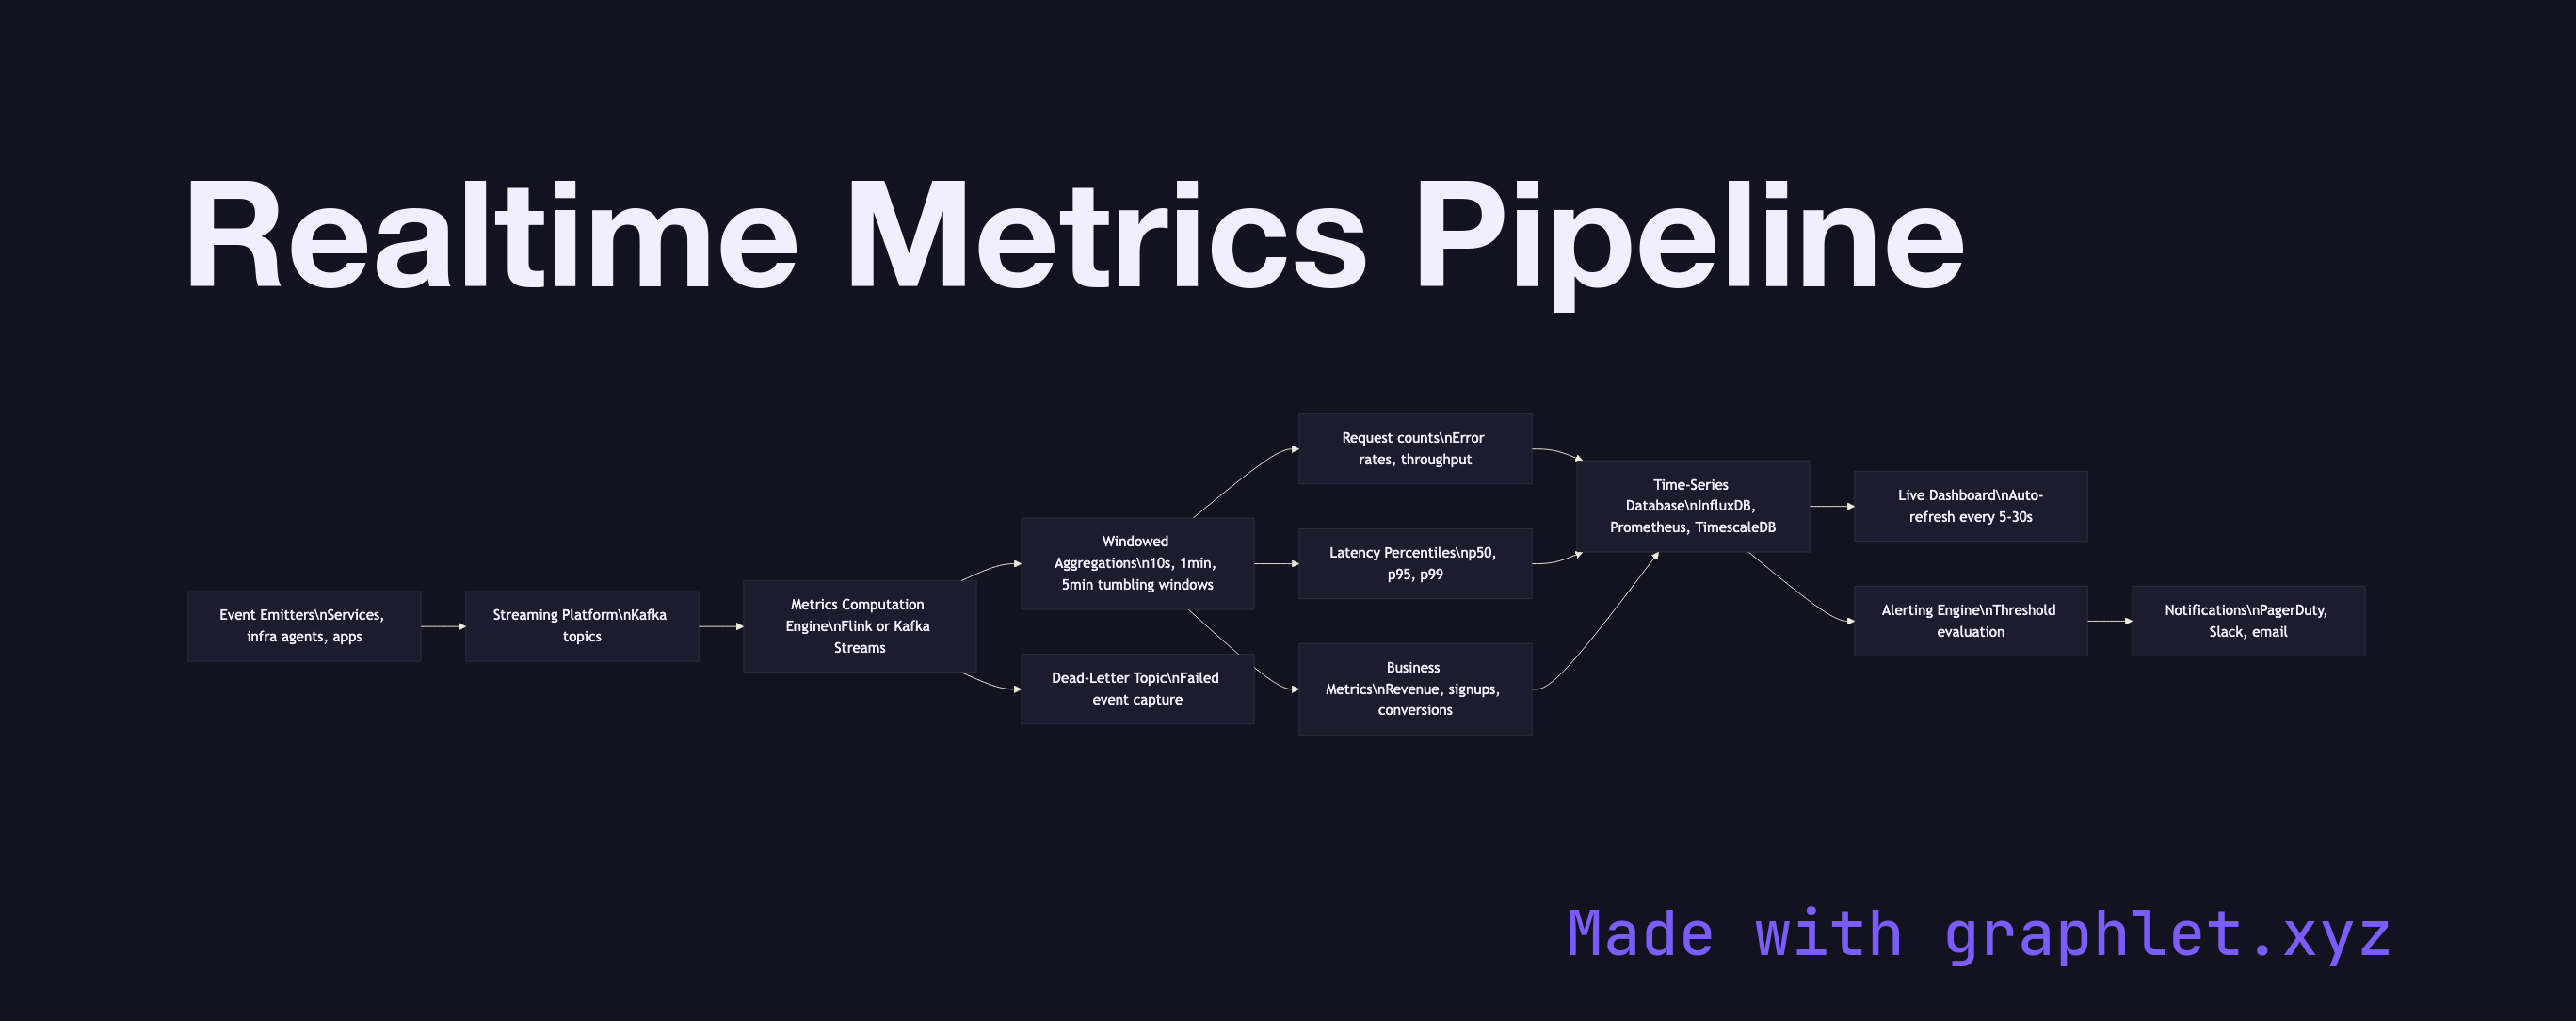
Storage architecture is covered through Data Warehouse Pipeline and Data Lake Architecture, two complementary approaches to persisting analytical data at scale. For real-time use cases, Stream Analytics Architecture and Realtime Metrics Pipeline illustrate how continuous queries and aggregations operate on live data streams. Finally, Analytics Dashboard Pipeline closes the loop by showing how processed data reaches end-user visualizations. Every diagram is free to edit and export in Graphlet.