diagram.mmd — sequence
Distributed Tracing Flow sequence diagram

Distributed tracing is an observability technique that tracks a single request as it travels across multiple services, assigning it a unique trace ID and recording a span for each service hop so engineers can reconstruct the full call graph, identify latency hotspots, and debug failures in distributed systems.

What the diagram shows

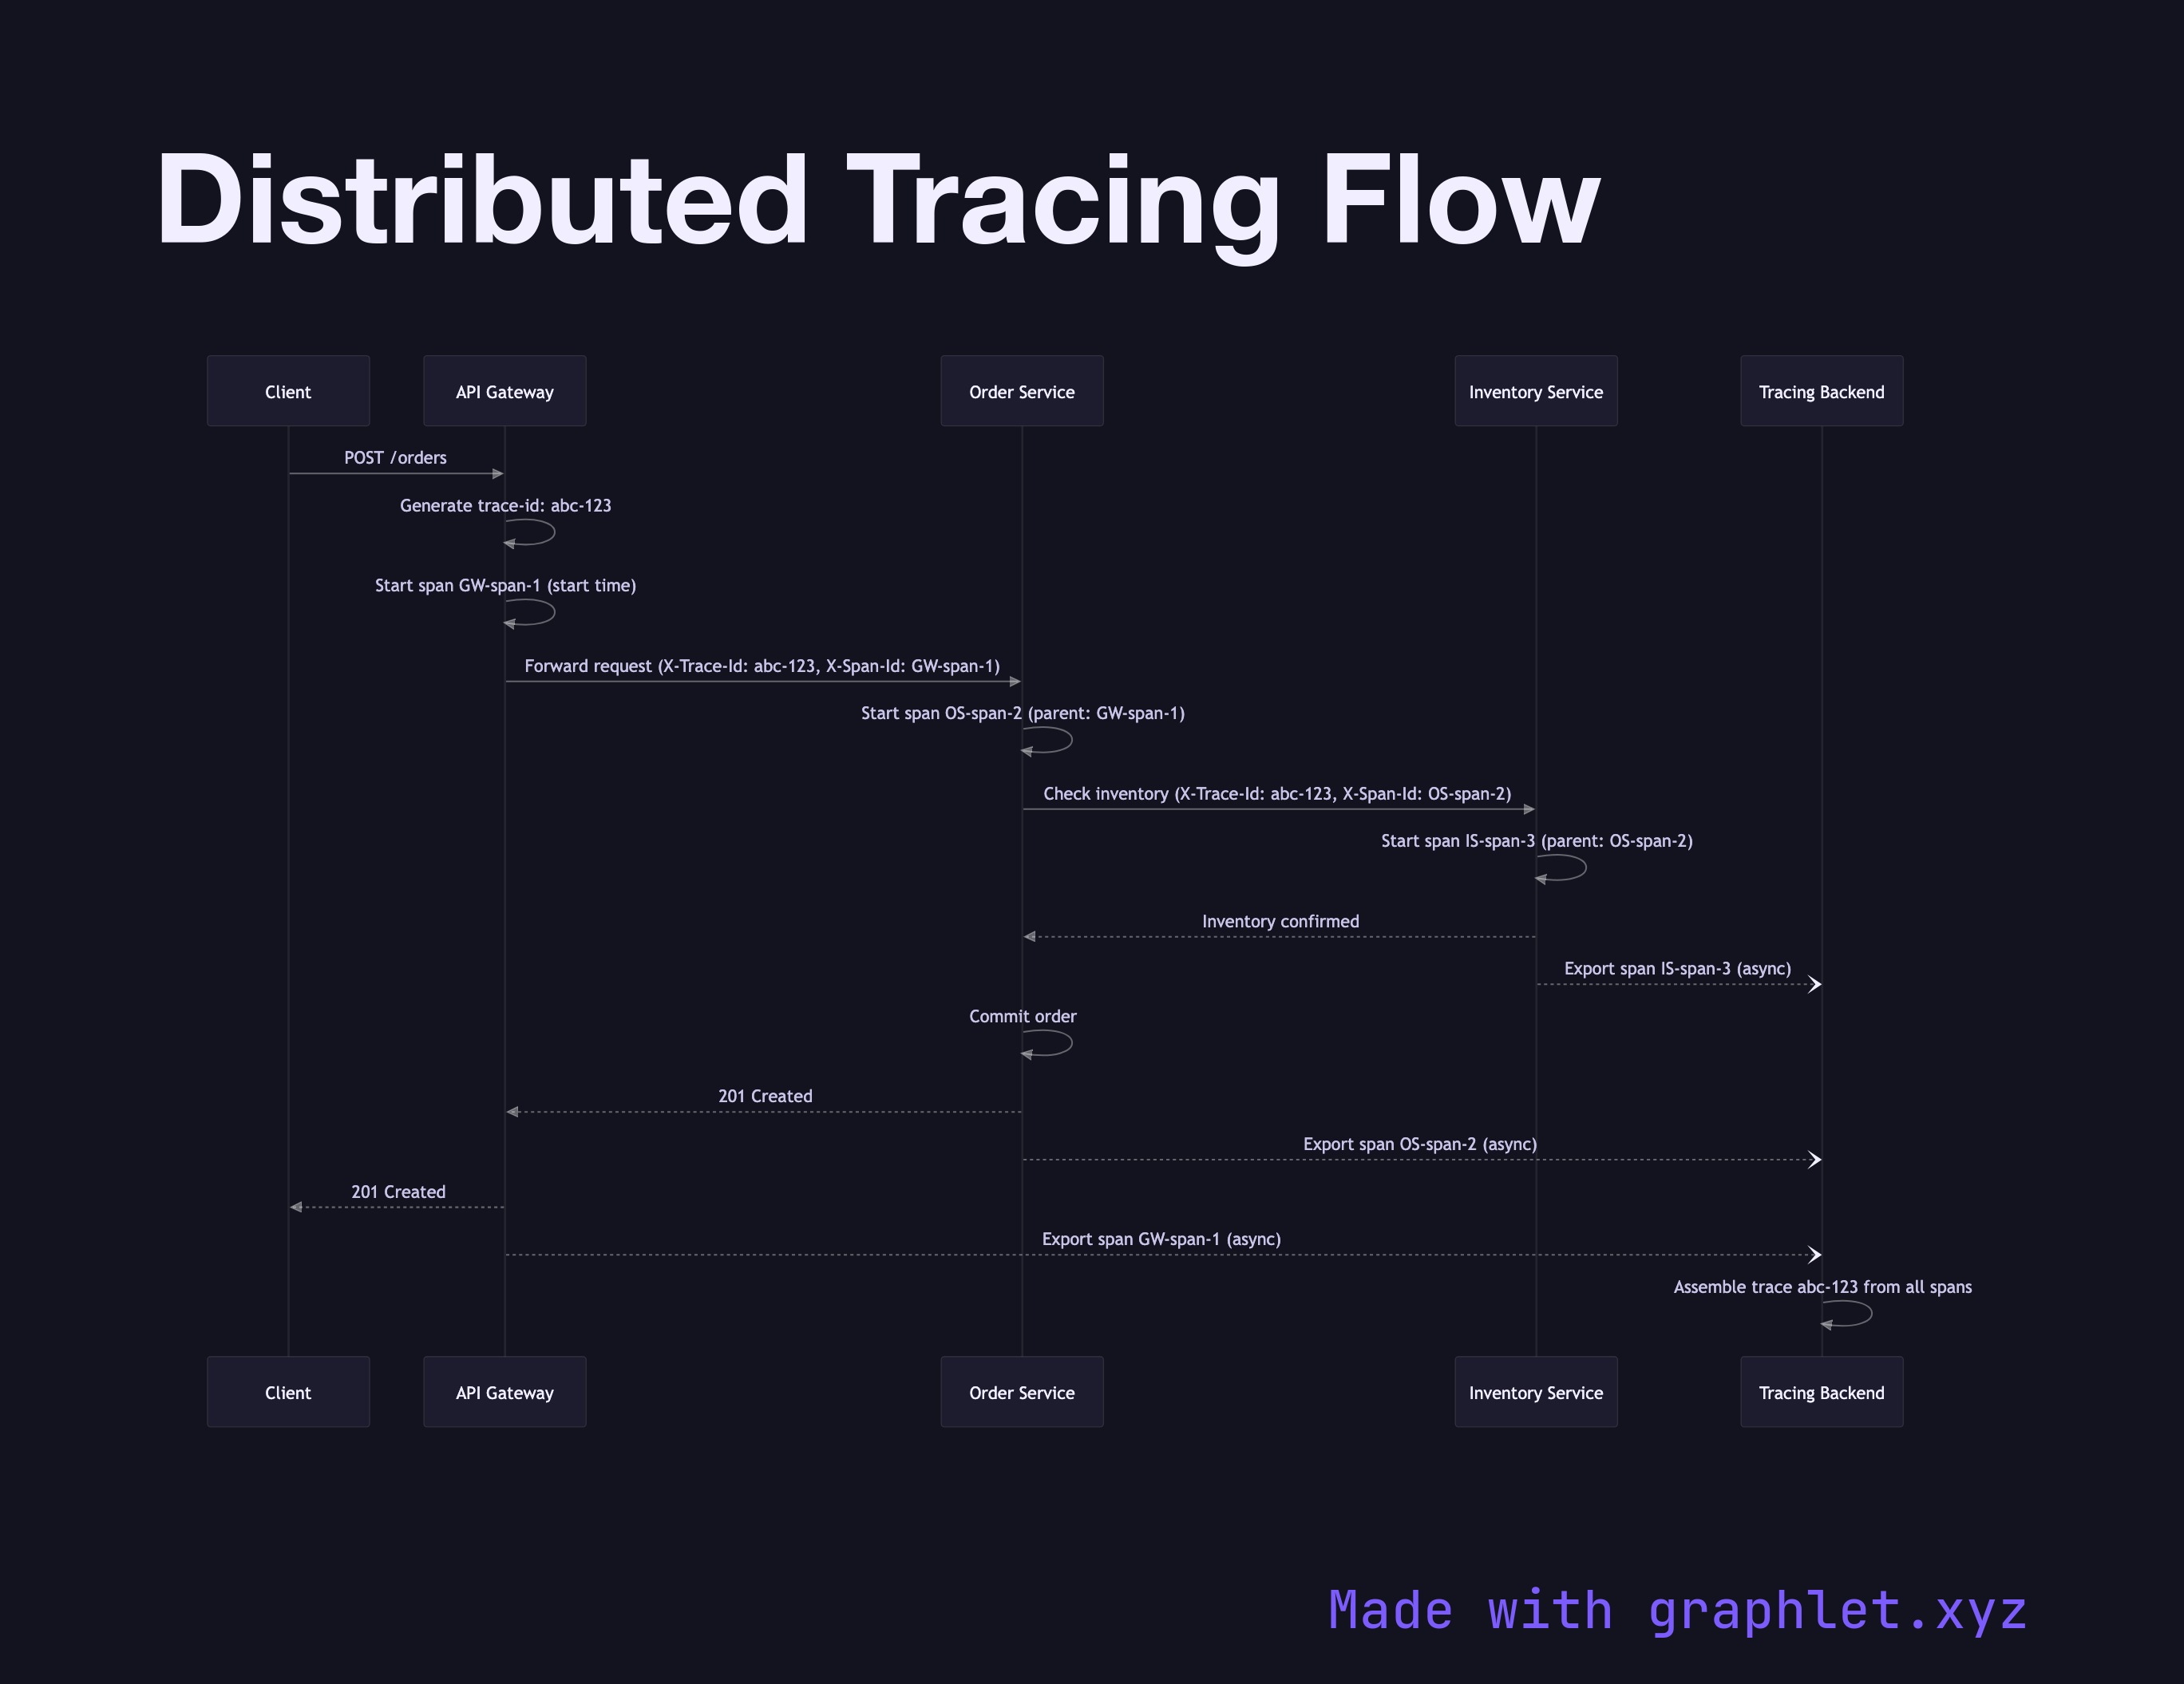
This sequence diagram follows a request from the Client through an API Gateway, Order Service, Inventory Service, and finally to a Tracing Backend (e.g., Jaeger, Zipkin, or OpenTelemetry Collector).

Key mechanics illustrated:

1. Trace ID created at entry: the API Gateway generates a trace-id (e.g., abc-123) and attaches it to the request as a header (X-Trace-Id). 2. Span created per hop: each service creates a child span with its own span-id, recording a start timestamp, end timestamp, and metadata (service name, operation, status). 3. Context propagated downstream: when a service makes a downstream call, it forwards the trace-id and its own span-id (as the parent span ID) in outbound request headers. 4. Spans exported asynchronously: each service reports its span to the tracing backend asynchronously — out of band from the request path — so tracing overhead doesn't add synchronous latency. 5. Trace assembled: the tracing backend assembles all spans for a given trace-id into a waterfall view, showing which service took how long at each step.

Why this matters

In a microservices system, a single user-facing request may touch dozens of services. When latency spikes, logs from individual services don't tell you which hop is slow. Distributed traces give you the full picture in one view. OpenTelemetry has become the vendor-neutral standard for instrumentation, with exporters for Jaeger, Zipkin, Datadog, and others.

Tracing complements the Microservice Request Chain diagram by adding observability on top of the call graph. For async workloads, see Background Job Processing — trace context can be serialized into job queues to trace across async boundaries.

Free online editor
Edit this diagram in Graphlet
Fork, modify, and export to SVG or PNG. No sign-up required.
Open in Graphlet →

Frequently asked questions

Distributed tracing is an observability technique that tracks a single request as it travels across multiple services in a distributed system. Each service records a span — a timed record of its portion of the work — and all spans for a request share a common trace ID, allowing engineers to reconstruct the full call graph and identify exactly where time is spent.
When a request enters the system, the API gateway assigns a unique trace ID and attaches it to the request as a header. Each downstream service creates a child span with its own span ID, records start and end timestamps, and forwards the trace ID and its span ID (as the parent) in any further downstream calls. Spans are exported asynchronously to a tracing backend — such as Jaeger, Zipkin, or an OpenTelemetry Collector — which assembles them into a waterfall view.
Use distributed tracing in any system where a single user-facing request touches more than one service. It is essential for diagnosing latency spikes, because logs from individual services cannot tell you which service in a chain is slow. It is also valuable for understanding service dependency graphs and for setting SLO budgets per service hop.
The most common mistake is sampling too aggressively in production (e.g., 1% of requests), which makes it impossible to find traces for specific failing requests. Another mistake is not propagating trace context across async boundaries — if a background job doesn't carry the trace ID from the originating request, the trace breaks and the async portion is invisible. Teams also sometimes forget to add business-relevant attributes (user ID, order ID) to spans, limiting the trace's usefulness for debugging domain issues.
mermaid
sequenceDiagram participant C as Client participant GW as API Gateway participant OS as Order Service participant IS as Inventory Service participant TB as Tracing Backend C->>GW: POST /orders GW->>GW: Generate trace-id: abc-123 GW->>GW: Start span GW-span-1 (start time) GW->>OS: Forward request (X-Trace-Id: abc-123, X-Span-Id: GW-span-1) OS->>OS: Start span OS-span-2 (parent: GW-span-1) OS->>IS: Check inventory (X-Trace-Id: abc-123, X-Span-Id: OS-span-2) IS->>IS: Start span IS-span-3 (parent: OS-span-2) IS-->>OS: Inventory confirmed IS--)TB: Export span IS-span-3 (async) OS->>OS: Commit order OS-->>GW: 201 Created OS--)TB: Export span OS-span-2 (async) GW-->>C: 201 Created GW--)TB: Export span GW-span-1 (async) TB->>TB: Assemble trace abc-123 from all spans
Copied to clipboard