Data Ingestion Pipeline
A data ingestion pipeline is the infrastructure that reliably moves data from one or more source systems into a central storage layer where it can be queried, transformed, and analyzed.
A data ingestion pipeline is the infrastructure that reliably moves data from one or more source systems into a central storage layer where it can be queried, transformed, and analyzed.
Data ingestion is the entry point for almost every analytics system. Without it, data remains siloed in operational databases, SaaS platforms, application logs, and event streams — inaccessible for cross-system analysis. The pipeline's primary job is to extract that data, handle the operational complexity of connecting to heterogeneous sources, and deliver it to a target store in a form the downstream systems expect.
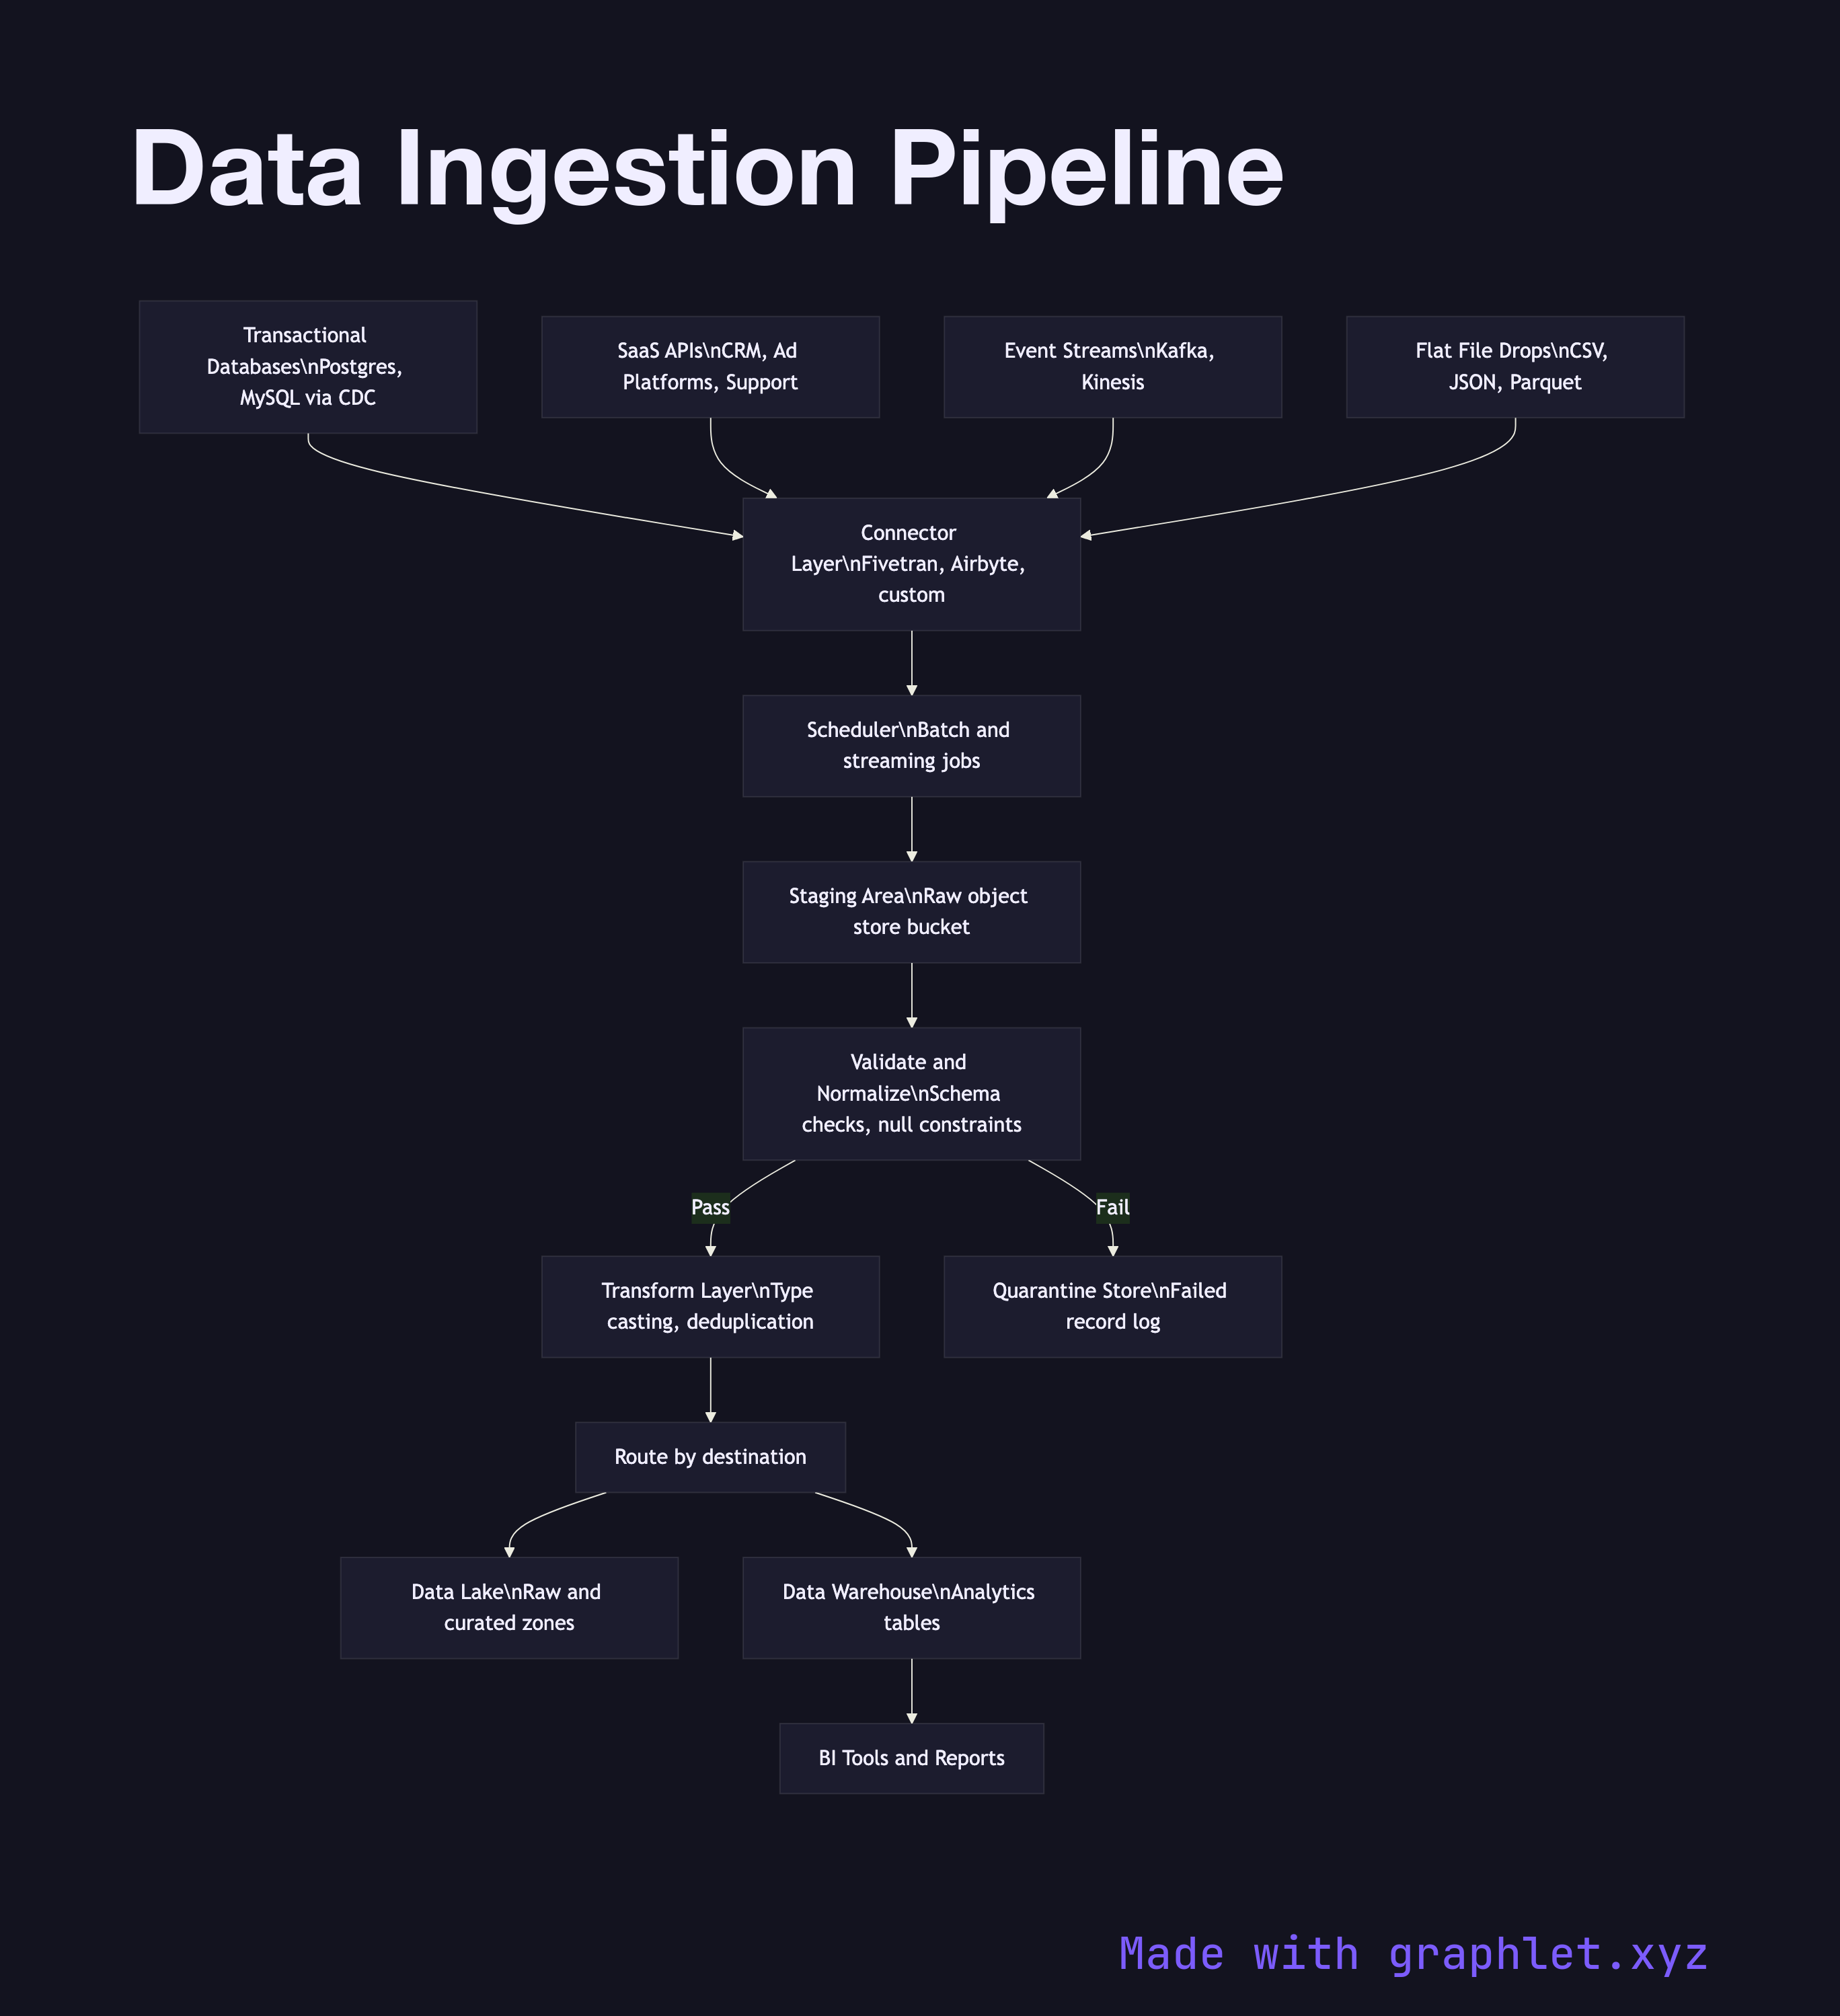
At the source layer, data originates from multiple systems simultaneously: transactional databases (via change data capture or scheduled exports), third-party SaaS APIs (CRMs, ad platforms, support tools), application event streams, and flat-file drops from partners. Each source type demands a different connector with its own authentication, rate-limiting, and incremental-load logic.
A connector and scheduler layer manages when and how each source is polled. Batch connectors run on a schedule (hourly, daily) and pull full or incremental snapshots. Streaming connectors maintain a persistent connection and forward records in near-real-time. All raw payloads are written to a staging area — often an object store bucket — before any transformation occurs. This staging layer acts as a checkpoint: if a downstream step fails, reprocessing starts from the raw files rather than re-hitting the source.
From staging, a validation and normalization step checks for schema conformance, null constraints, and data type consistency. Records that fail validation are quarantined and logged for investigation. Valid records are handed to the ETL Workflow for transformation, or loaded directly into a raw zone within a Data Lake Architecture. The final destination is typically a Data Warehouse Pipeline where clean, conformed data becomes available for BI tools and reporting.