Search Analytics Pipeline
A search analytics pipeline collects, processes, and aggregates search events — queries, clicks, impressions, and zero-result rates — to produce dashboards, alerting signals, and training data for relevance improvement.
A search analytics pipeline collects, processes, and aggregates search events — queries, clicks, impressions, and zero-result rates — to produce dashboards, alerting signals, and training data for relevance improvement.
How the search analytics pipeline works
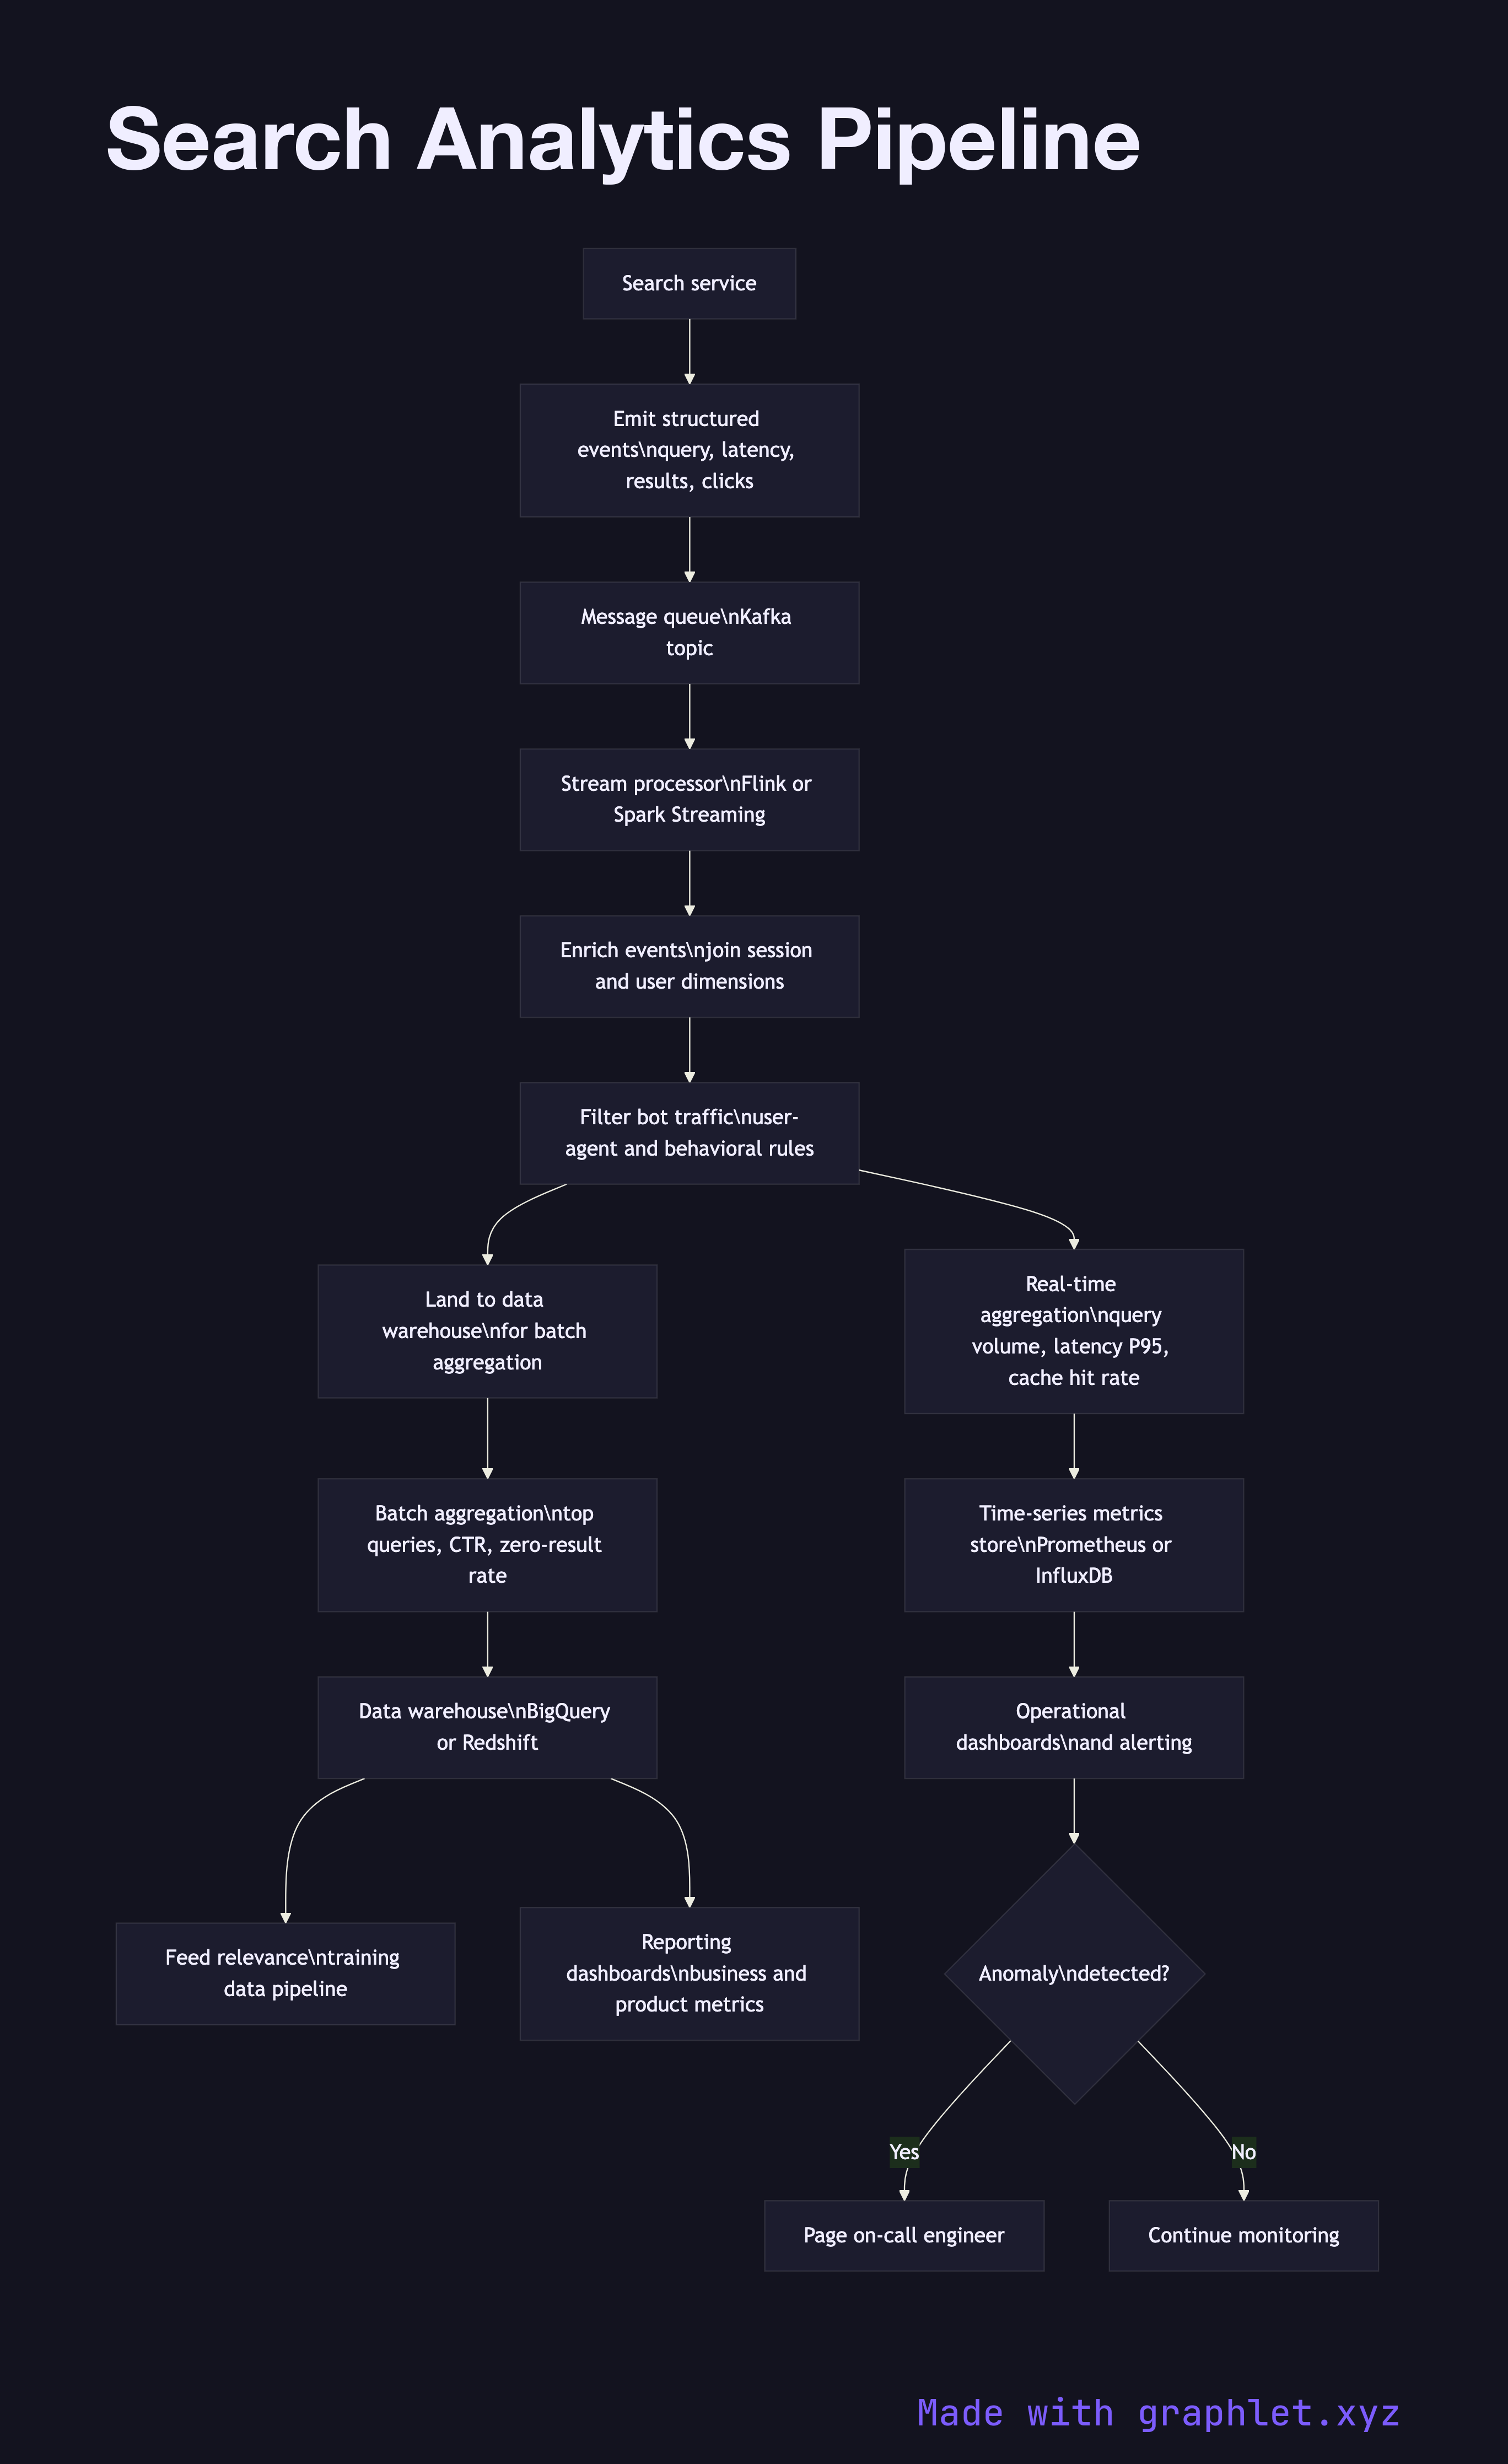
Event instrumentation is the source of all data. Every search request emits a structured event containing the query string, result count, response latency, and shard hit map. Every result impression emits the document ID, position, and whether the result was clicked. Client-side instrumentation captures dwell time and scroll depth after the click.
Event ingestion receives the stream of search events via a message queue (Kafka is the standard choice at scale). Events are produced by the search service and consumed by the analytics pipeline in near real time. The pipeline is architecturally similar to any Data Ingestion Pipeline, with search-specific schemas.
Stream processing enriches and filters raw events in motion. Enrichment joins each event with dimension data: the session ID is resolved to user attributes, document IDs are joined to their metadata, and geographic location is derived from IP. Bot traffic is filtered using a combination of user-agent rules and behavioral anomaly detection.
Aggregation computes the metrics that matter: query volume by time bucket, top queries by frequency, zero-result query rate, P50/P95/P99 latency, cache hit rate, and click-through rate by position. Both real-time (seconds-to-minutes latency, Flink or Spark Streaming) and batch aggregations (hours latency, Spark or BigQuery) are maintained.
Storage lands processed events and aggregates in a data warehouse for ad-hoc analysis and a time-series metrics store for dashboards and alerts. Raw events are retained in object storage for reprocessing when schemas change.
Dashboards and alerting surface operational health — a spike in zero-result rate or a latency regression triggers an alert. The Search Relevance Feedback loop reads from the same store to source training data for the Ranking Algorithm Pipeline.