Search infrastructure is one of the most technically demanding areas of backend engineering. A production search system must ingest and index billions of documents, answer queries in under 100 milliseconds, and continuously improve its results based on user behavior — all at the same time. This collection of 10 free Mermaid diagrams maps the core components and data flows you'll encounter when building or operating search at scale.

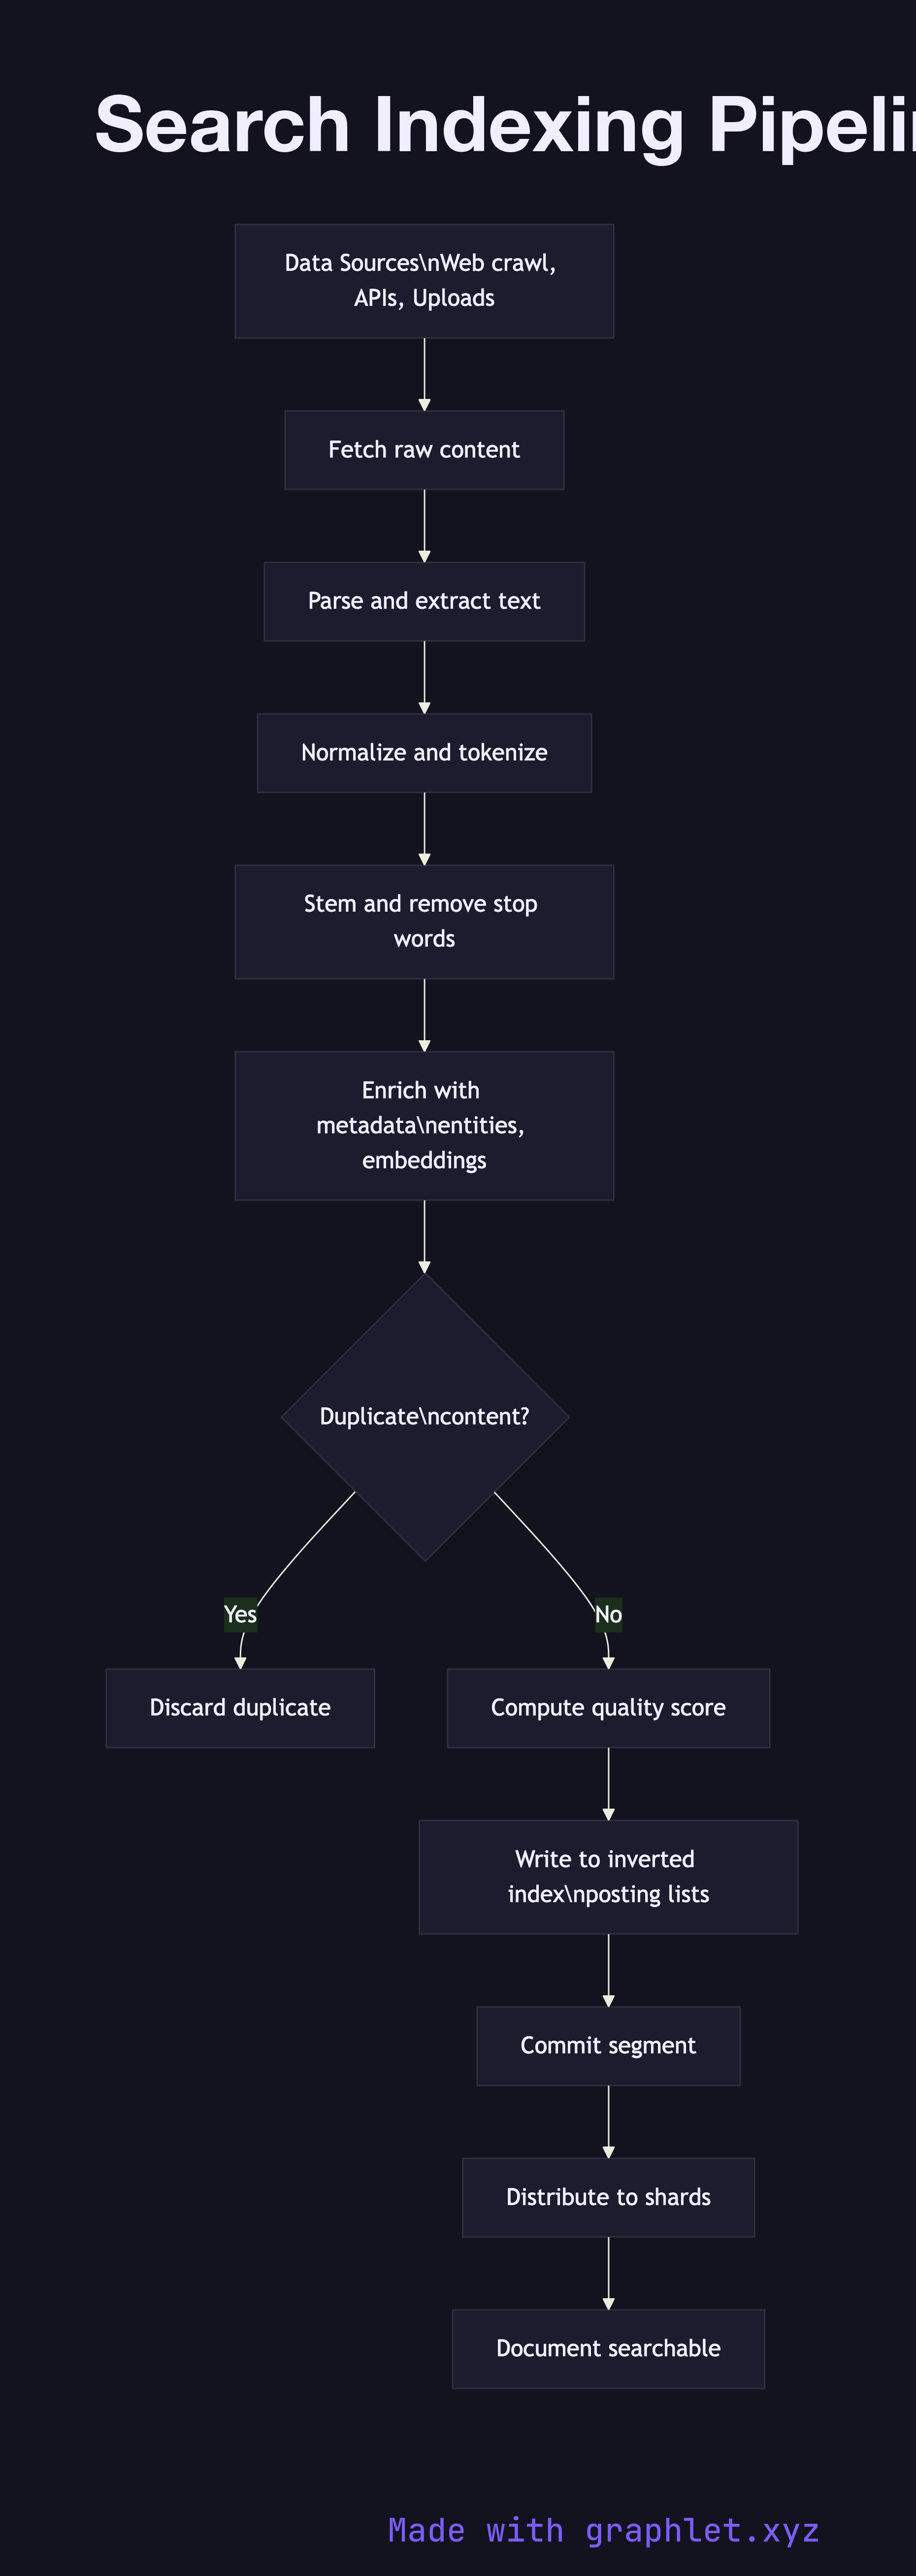
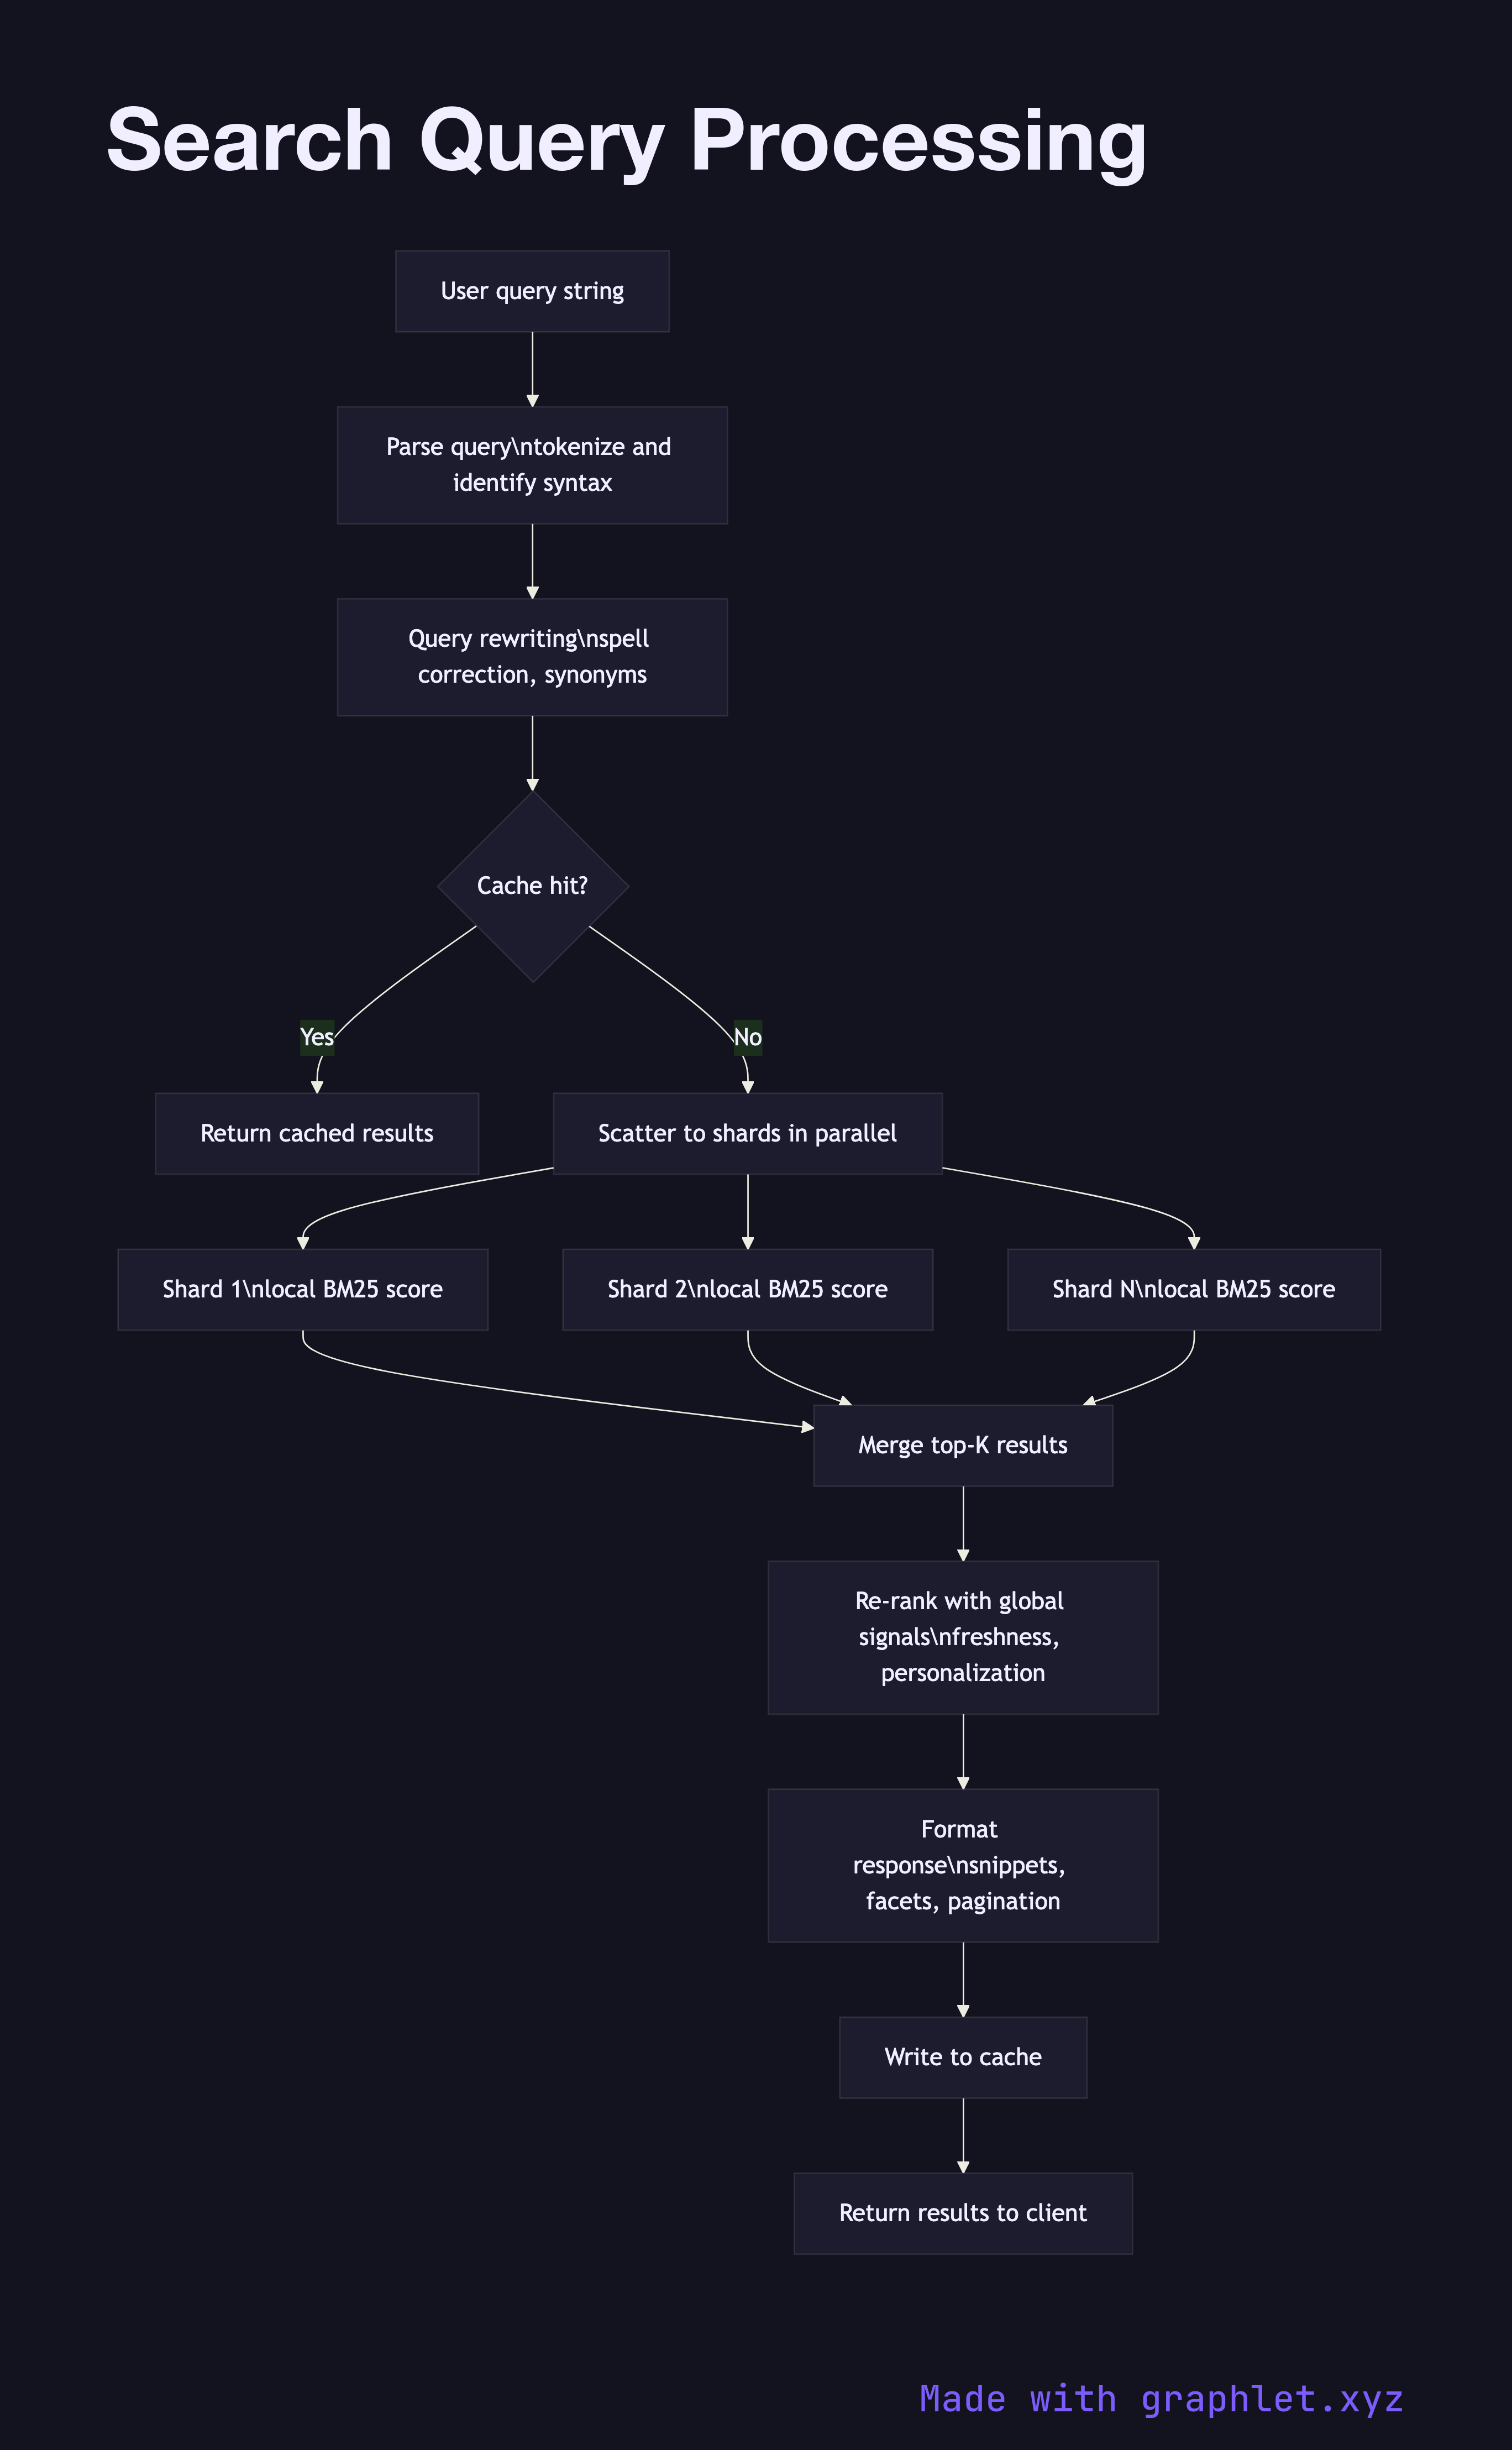
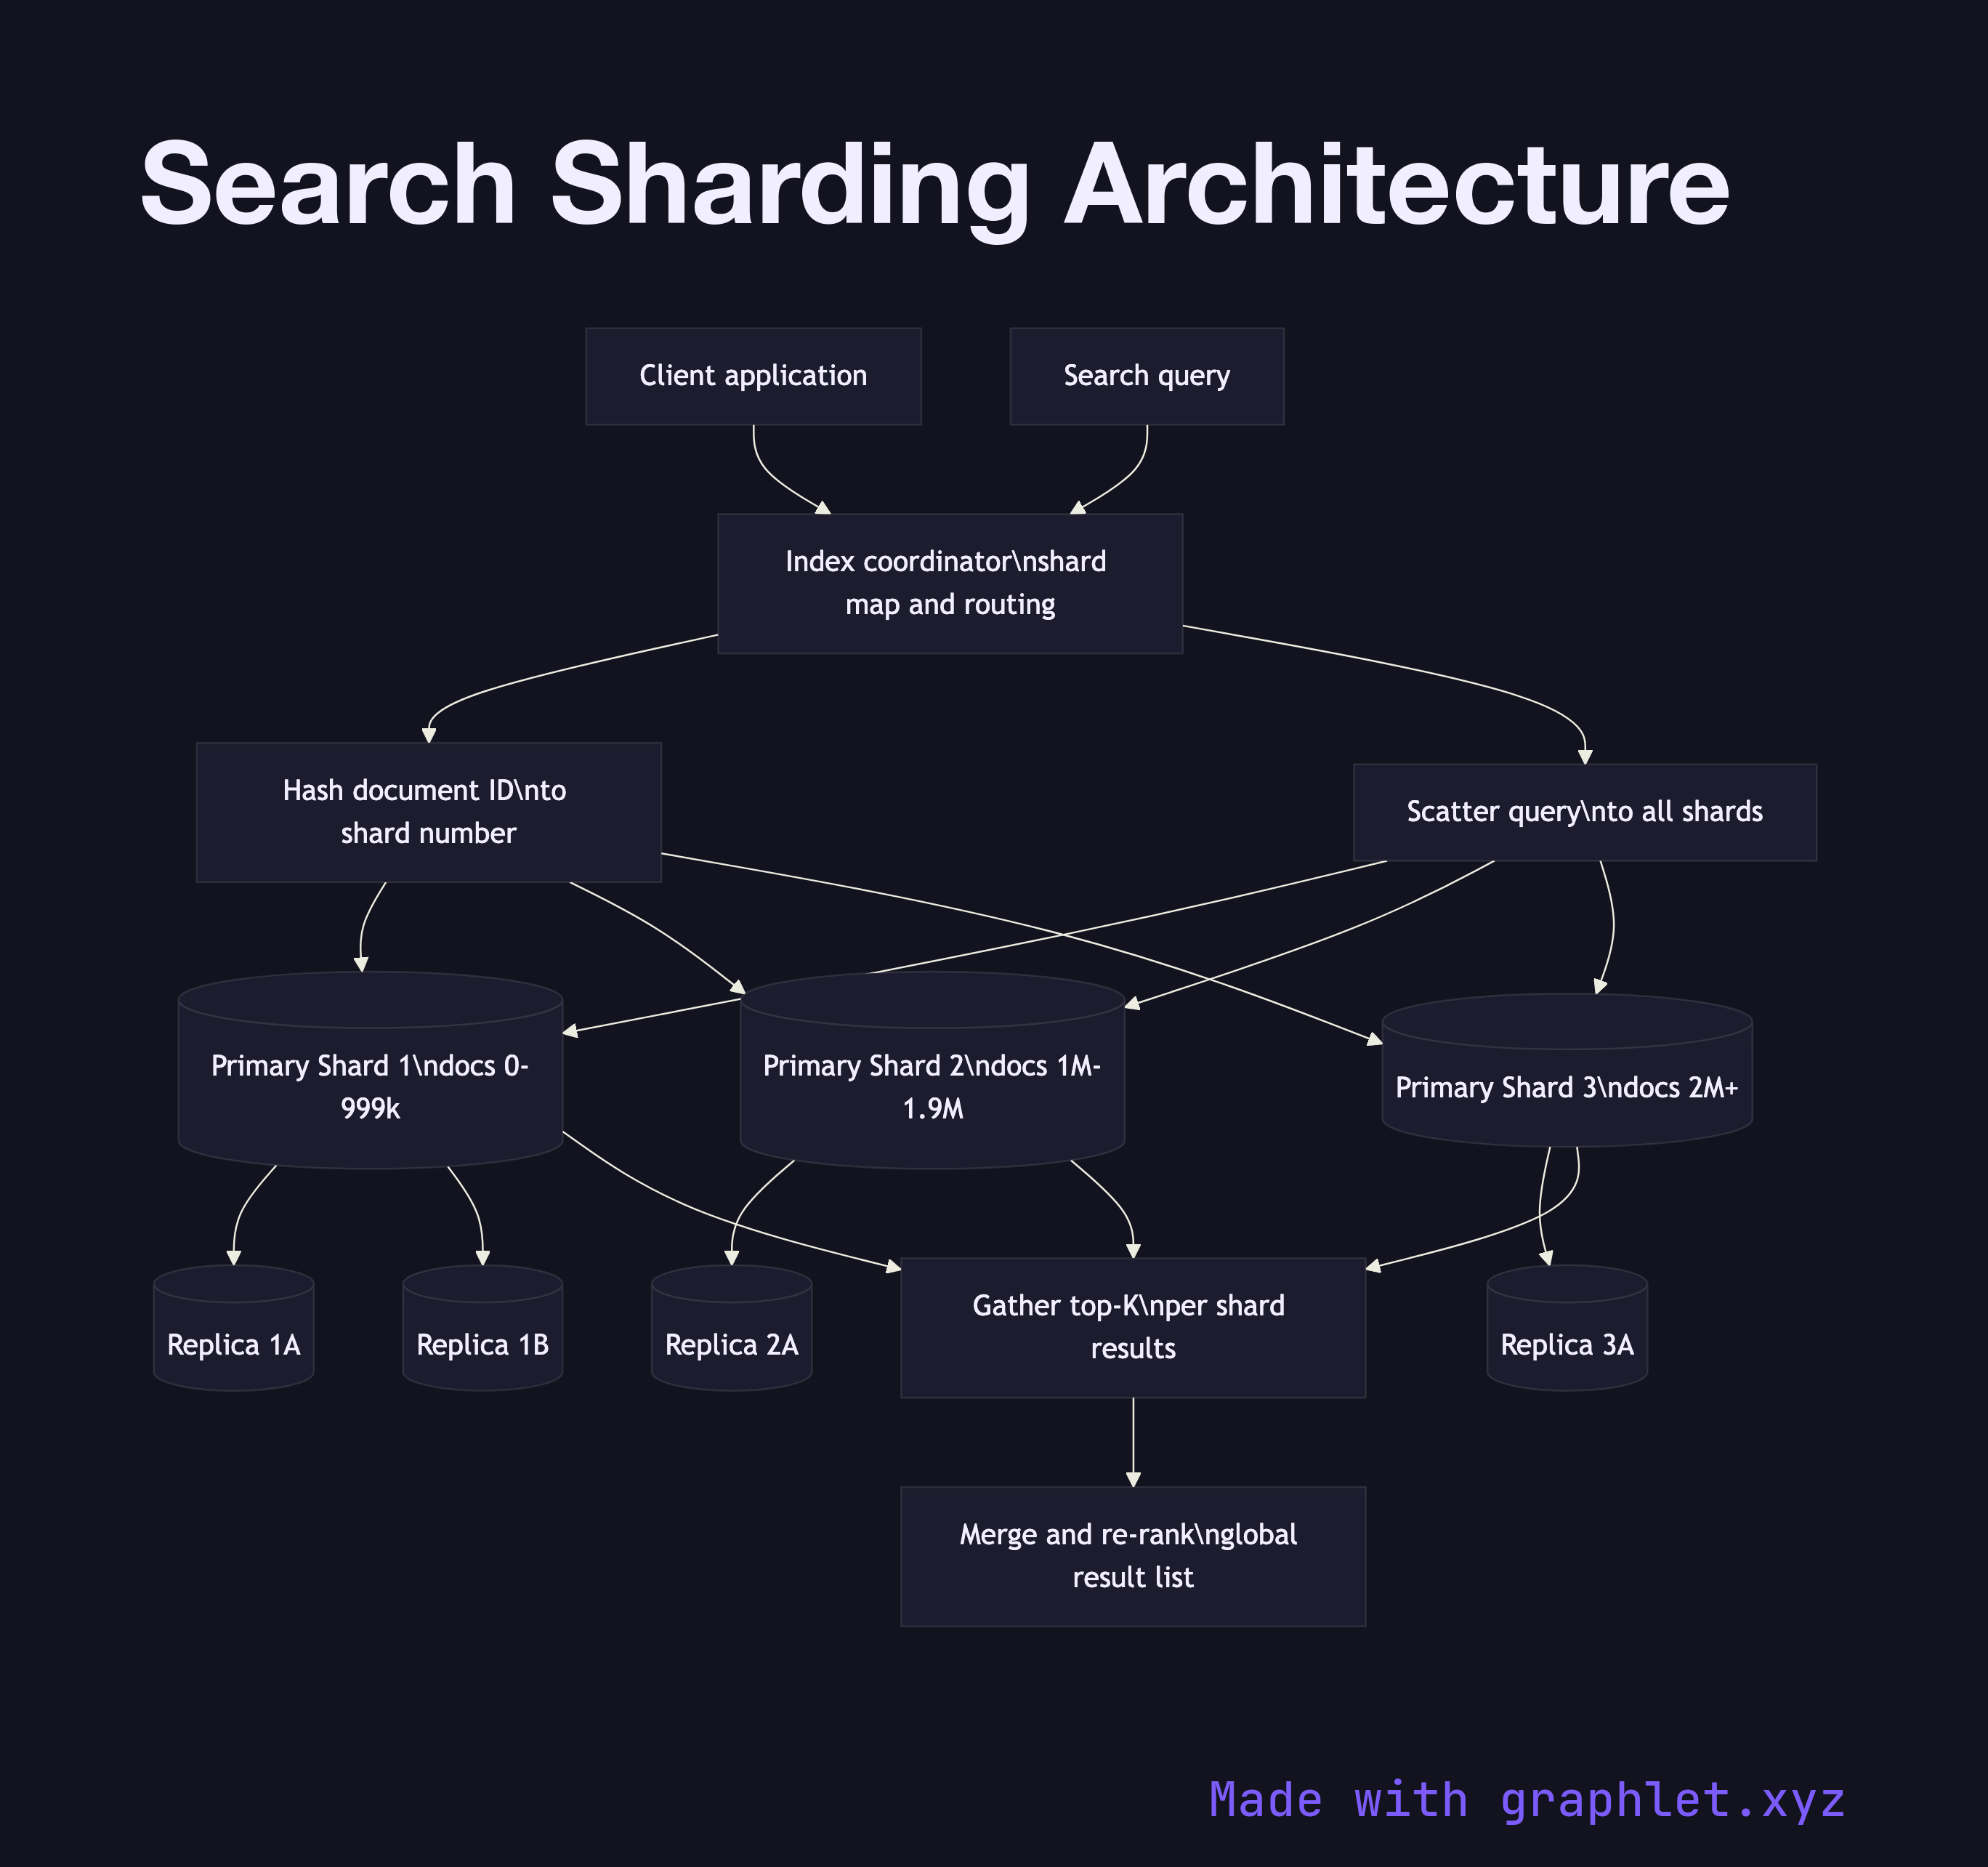
Start with the data path: the Search Indexing Pipeline shows how raw content moves from source through parsing, tokenization, and enrichment into an inverted index distributed across shards. The Search Sharding Architecture shows how that index is partitioned for horizontal scale. At query time, the Search Query Processing diagram traces how a raw string is parsed, rewritten, and executed across shards before results are merged and returned.

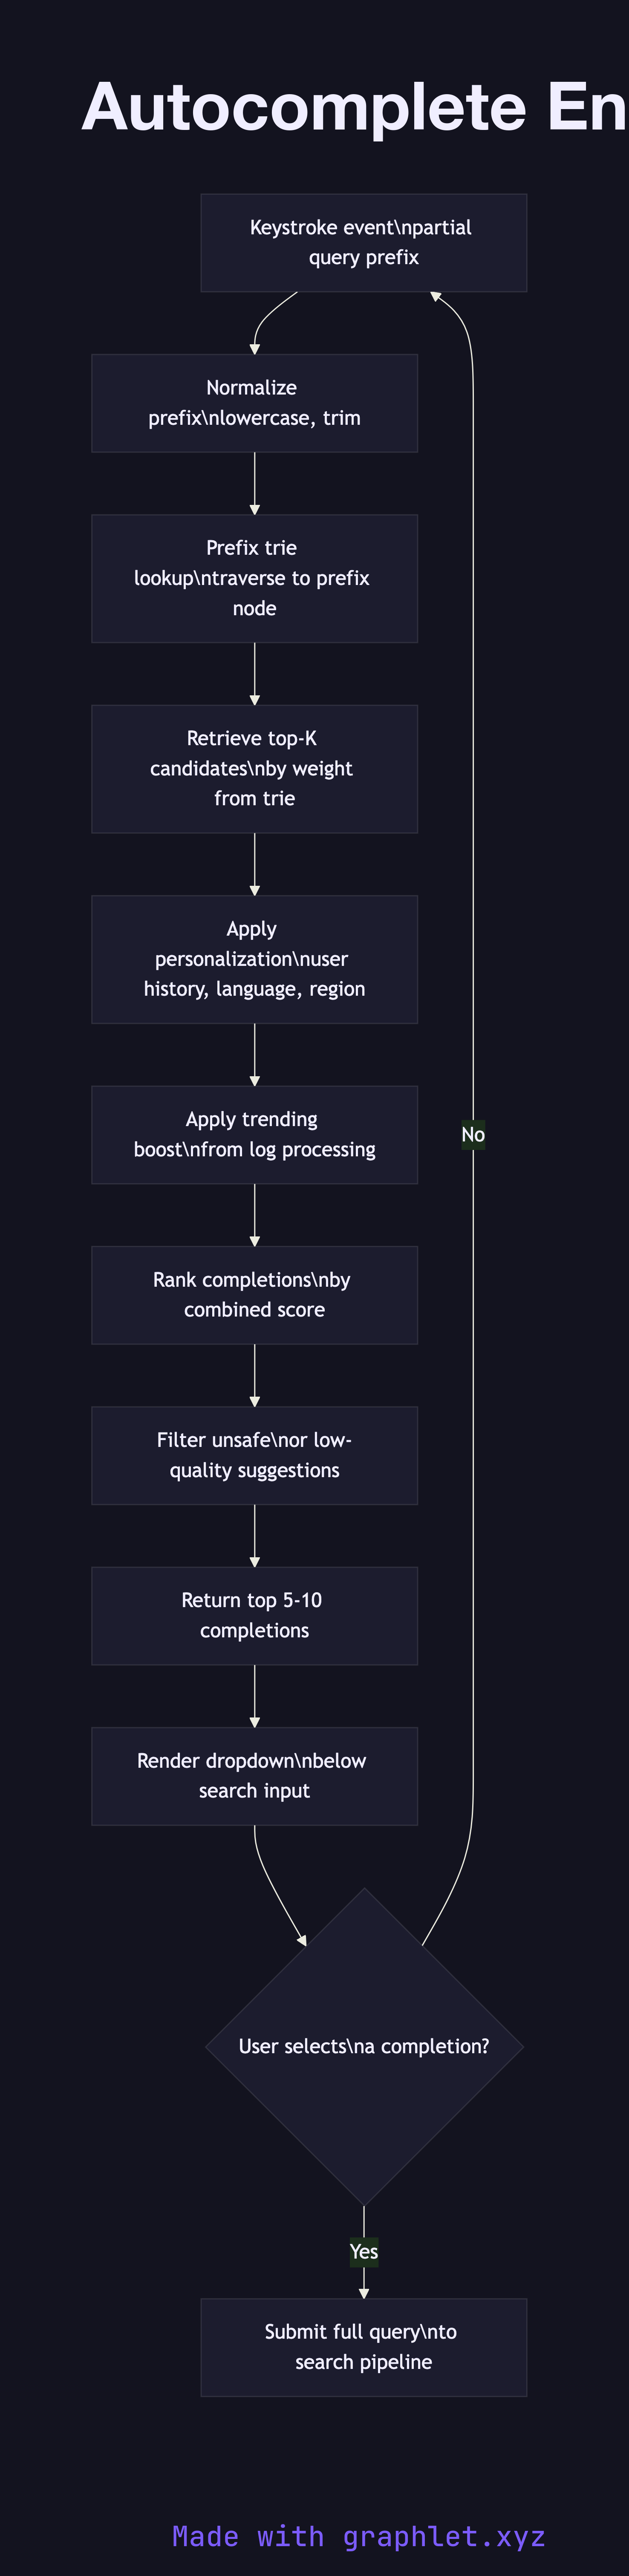
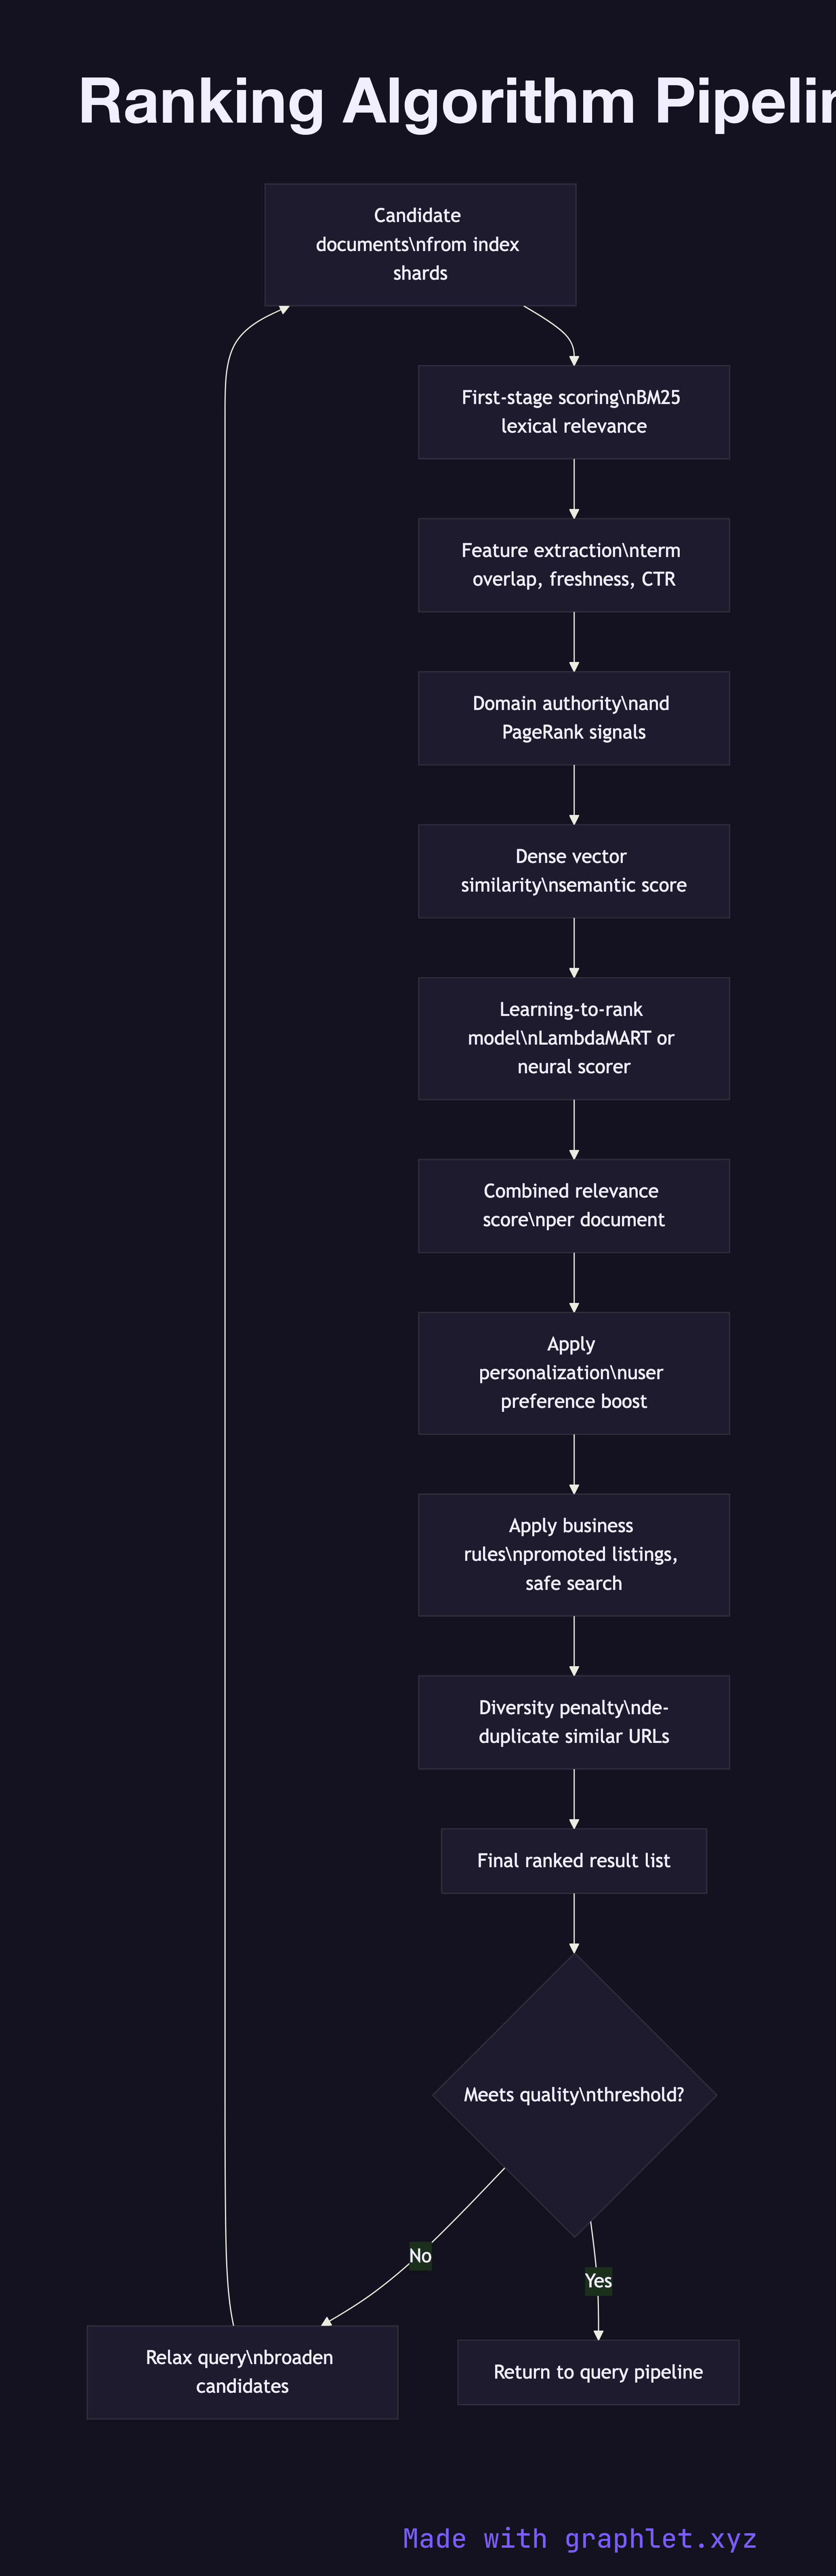
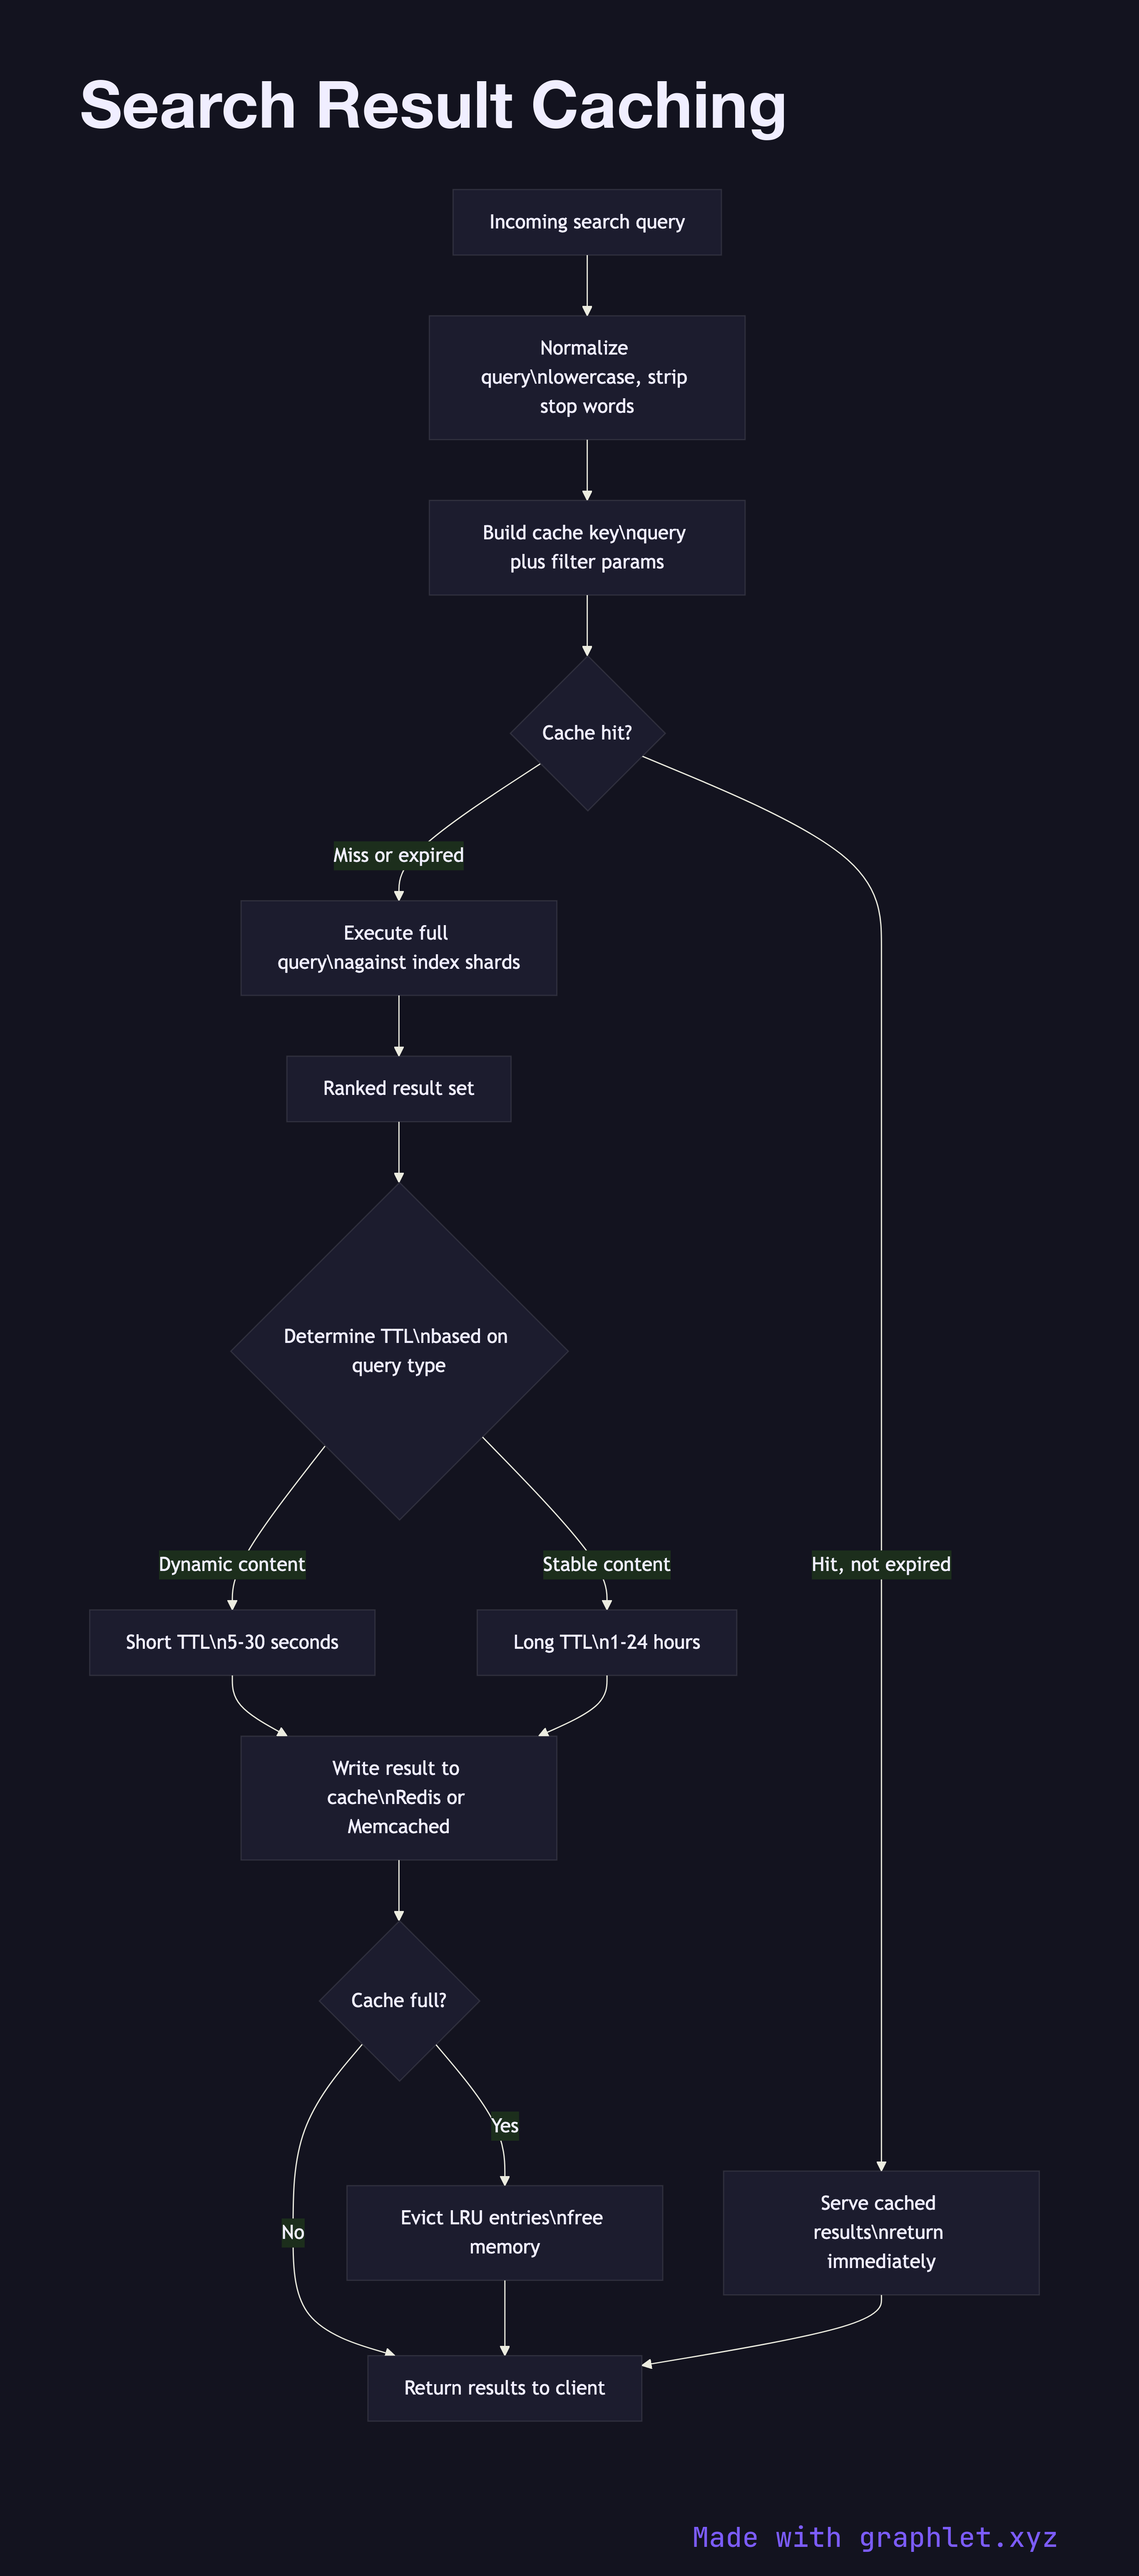
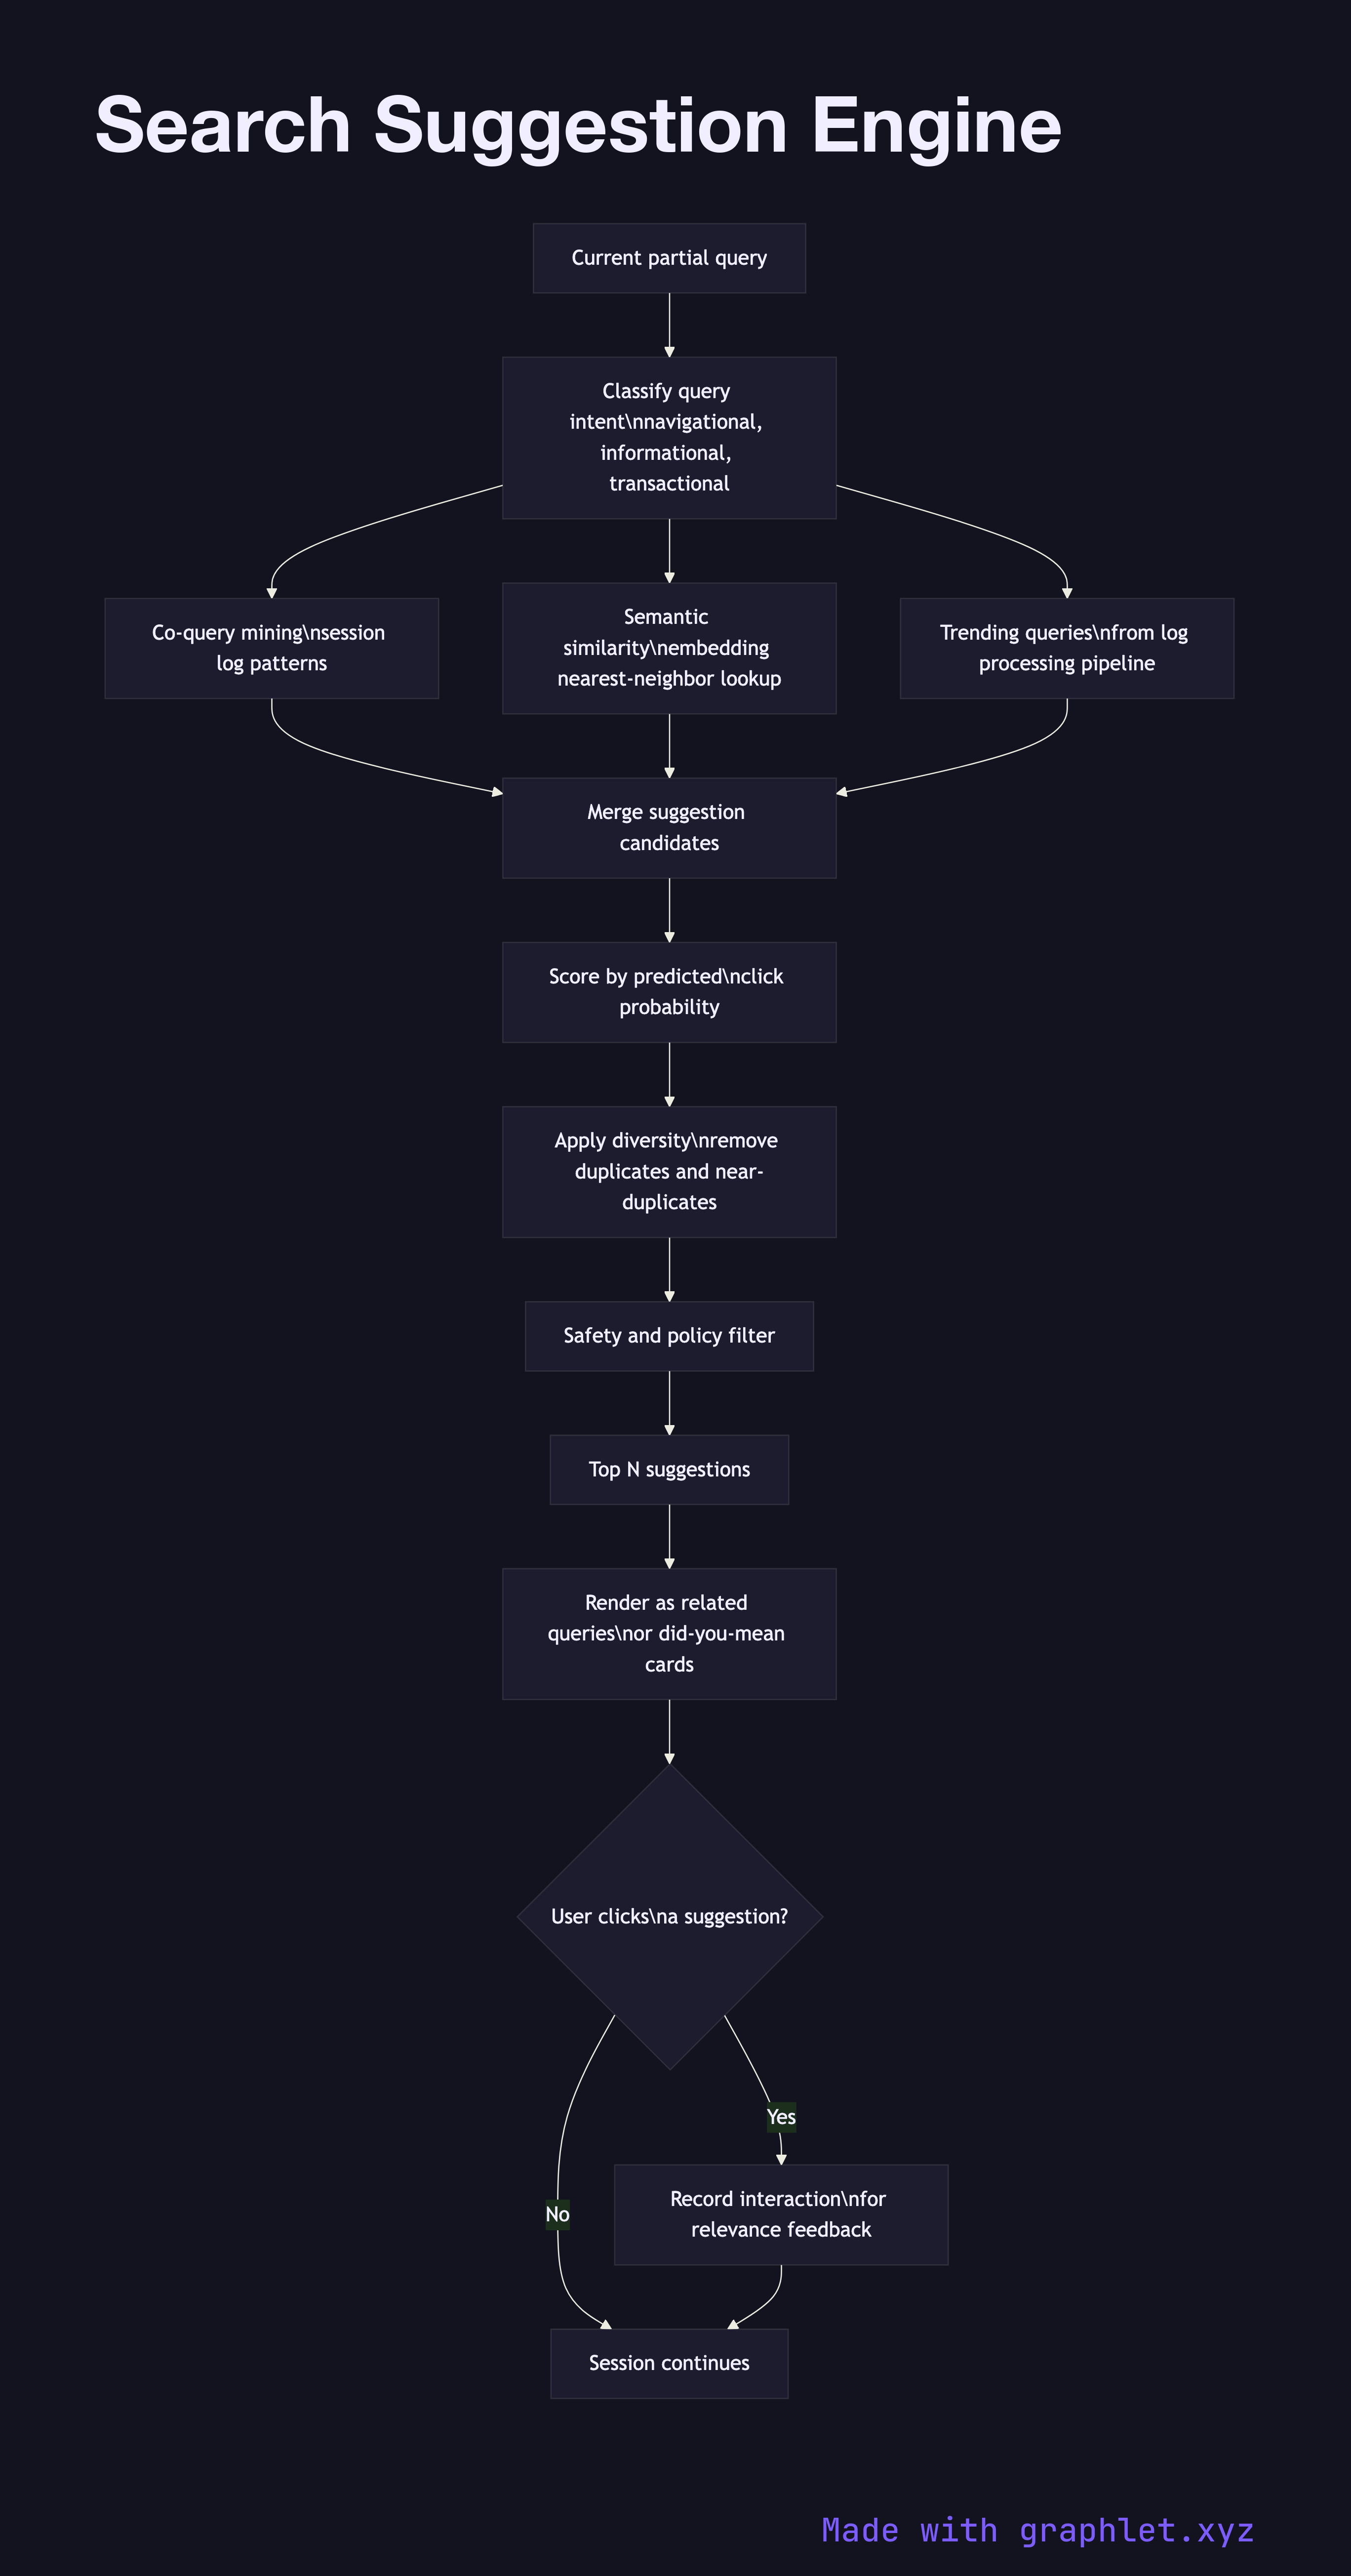
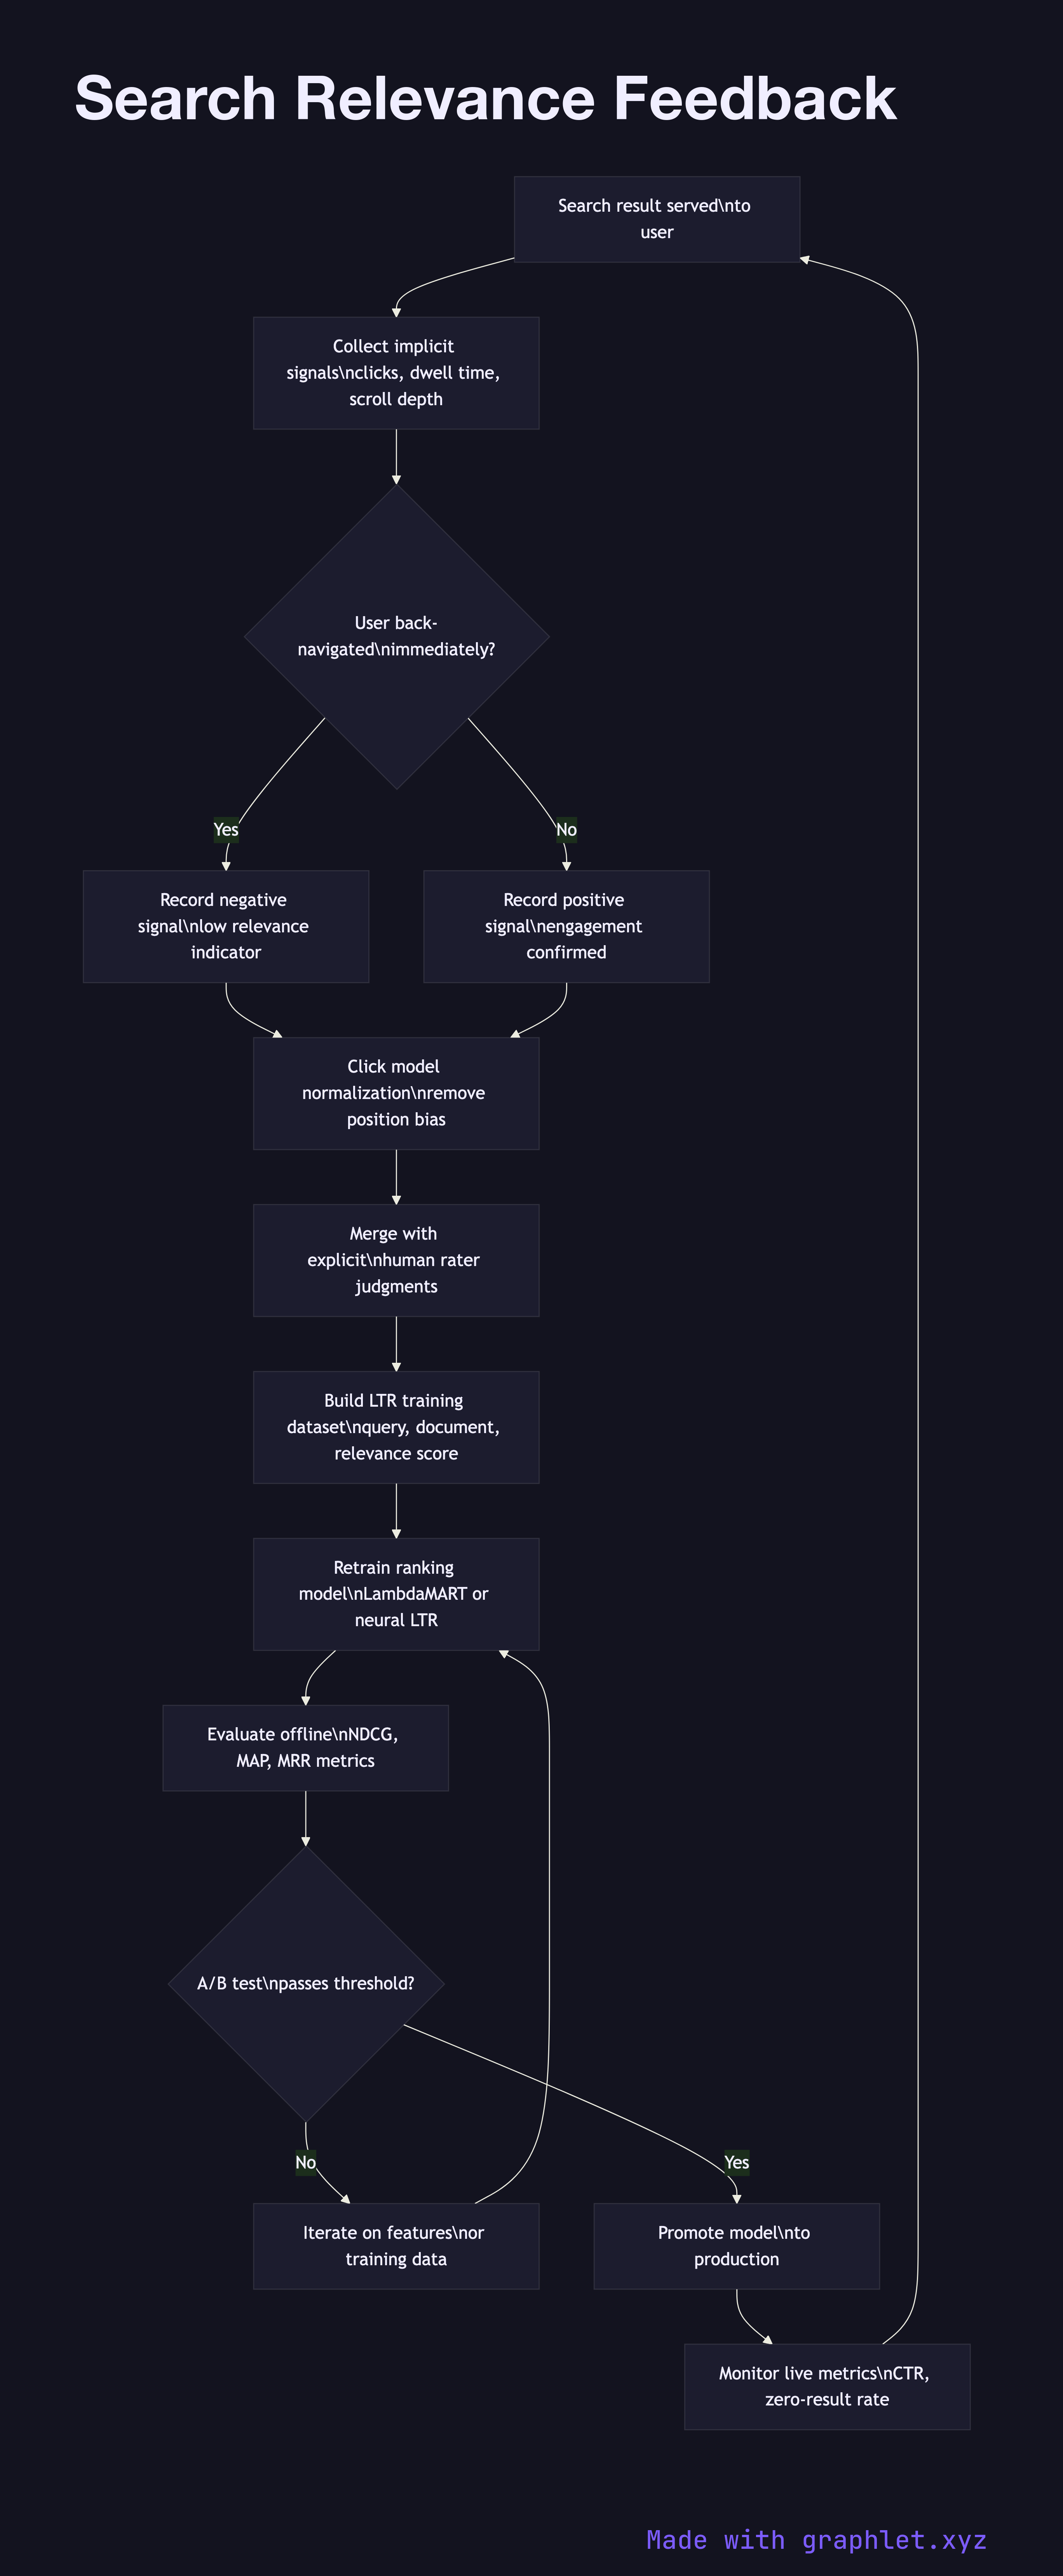
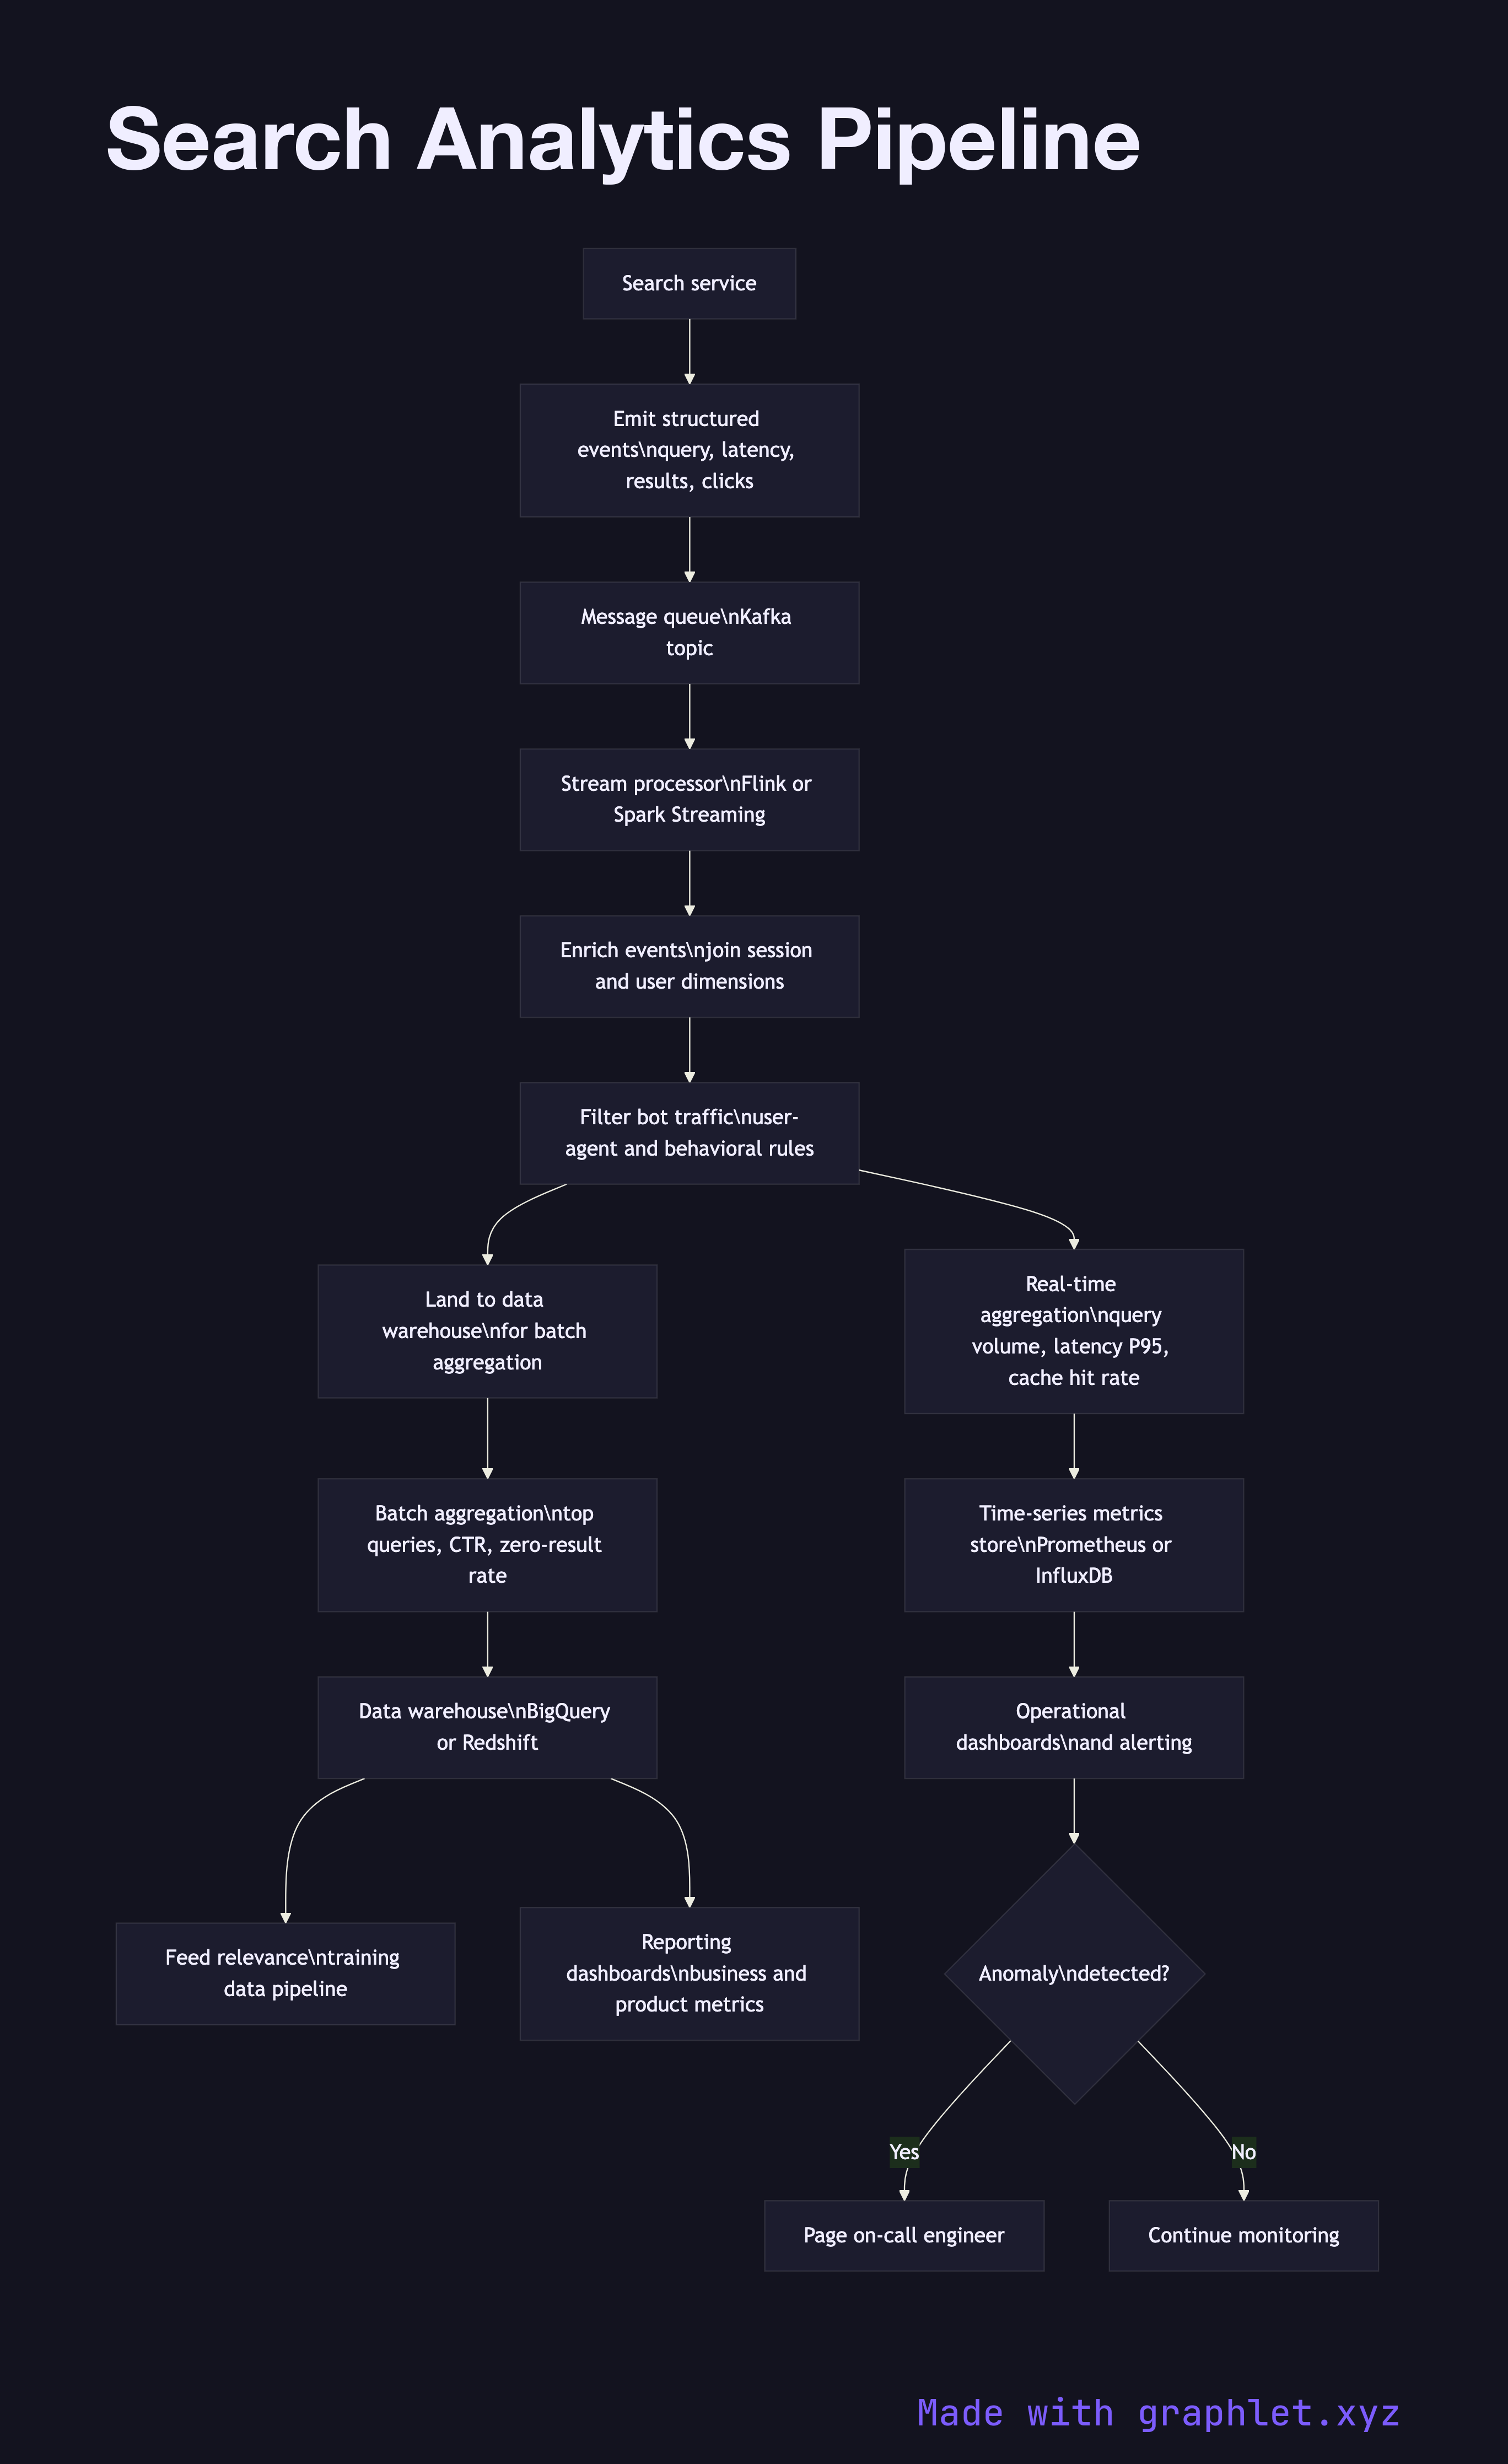
User experience features — Autocomplete Engine and Search Suggestion Engine — explain how prefix tries and behavioral signals produce fast, relevant completions. Ranking Algorithm Pipeline breaks down how BM25 scores, freshness signals, and personalization factors are combined into a final result order. Closing feedback loops is covered in Search Relevance Feedback. Operational concerns — Search Result Caching, Search Analytics Pipeline, and Search Log Processing — round out the collection. Every diagram is free to edit and export in Graphlet.

All diagrams 10 examples
Search Indexing Pipeline flowchart diagram
Search Indexing Pipeline
flowchart
Search Query Processing flowchart diagram
Search Query Processing
flowchart
Autocomplete Engine flowchart diagram
Autocomplete Engine
flowchart
Ranking Algorithm Pipeline flowchart diagram
Ranking Algorithm Pipeline
flowchart
Search Result Caching flowchart diagram
Search Result Caching
flowchart
Search Sharding Architecture flowchart diagram
Search Sharding Architecture
flowchart
Search Suggestion Engine flowchart diagram
Search Suggestion Engine
flowchart
Search Relevance Feedback flowchart diagram
Search Relevance Feedback
flowchart
Search Analytics Pipeline flowchart diagram
Search Analytics Pipeline
flowchart
Search Log Processing flowchart diagram
Search Log Processing
flowchart

Frequently asked questions

A search systems diagram is a visual map of the components and data flows that make up a search engine — covering stages such as indexing, query processing, ranking, caching, and sharding. Mermaid flowcharts are a common format because they render directly from plain text and are easy to version-control alongside code.
They give teams a shared reference when designing or debugging a search stack. A diagram surfaces integration points between subsystems — for example, where the indexing pipeline feeds into the sharding layer, or how the ranking model consumes signals from the log processing pipeline — making architectural decisions easier to discuss and document.
Use a Mermaid diagram when you need a lightweight, code-friendly illustration that can live in a README, a design doc, or a wiki page. They are especially useful during system design reviews, onboarding new engineers, or documenting how an existing production system is structured.
The ten diagrams in this collection cover the full lifecycle of a search system: document ingestion and the indexing pipeline, inverted index sharding, query parsing and execution, result caching, autocomplete and suggestion engines, BM25-based ranking, relevance feedback loops, analytics, and log processing.
Free online editor
Edit any diagram in Graphlet
Open, fork, and export to SVG or PNG. No sign-up required.
Open Graphlet →