diagram.mmd — flowchart
Threat Detection Pipeline flowchart diagram

A threat detection pipeline is a real-time data processing system that ingests security events from multiple sources, applies detection rules and machine learning models, correlates signals across sources, and generates prioritized alerts for security teams.

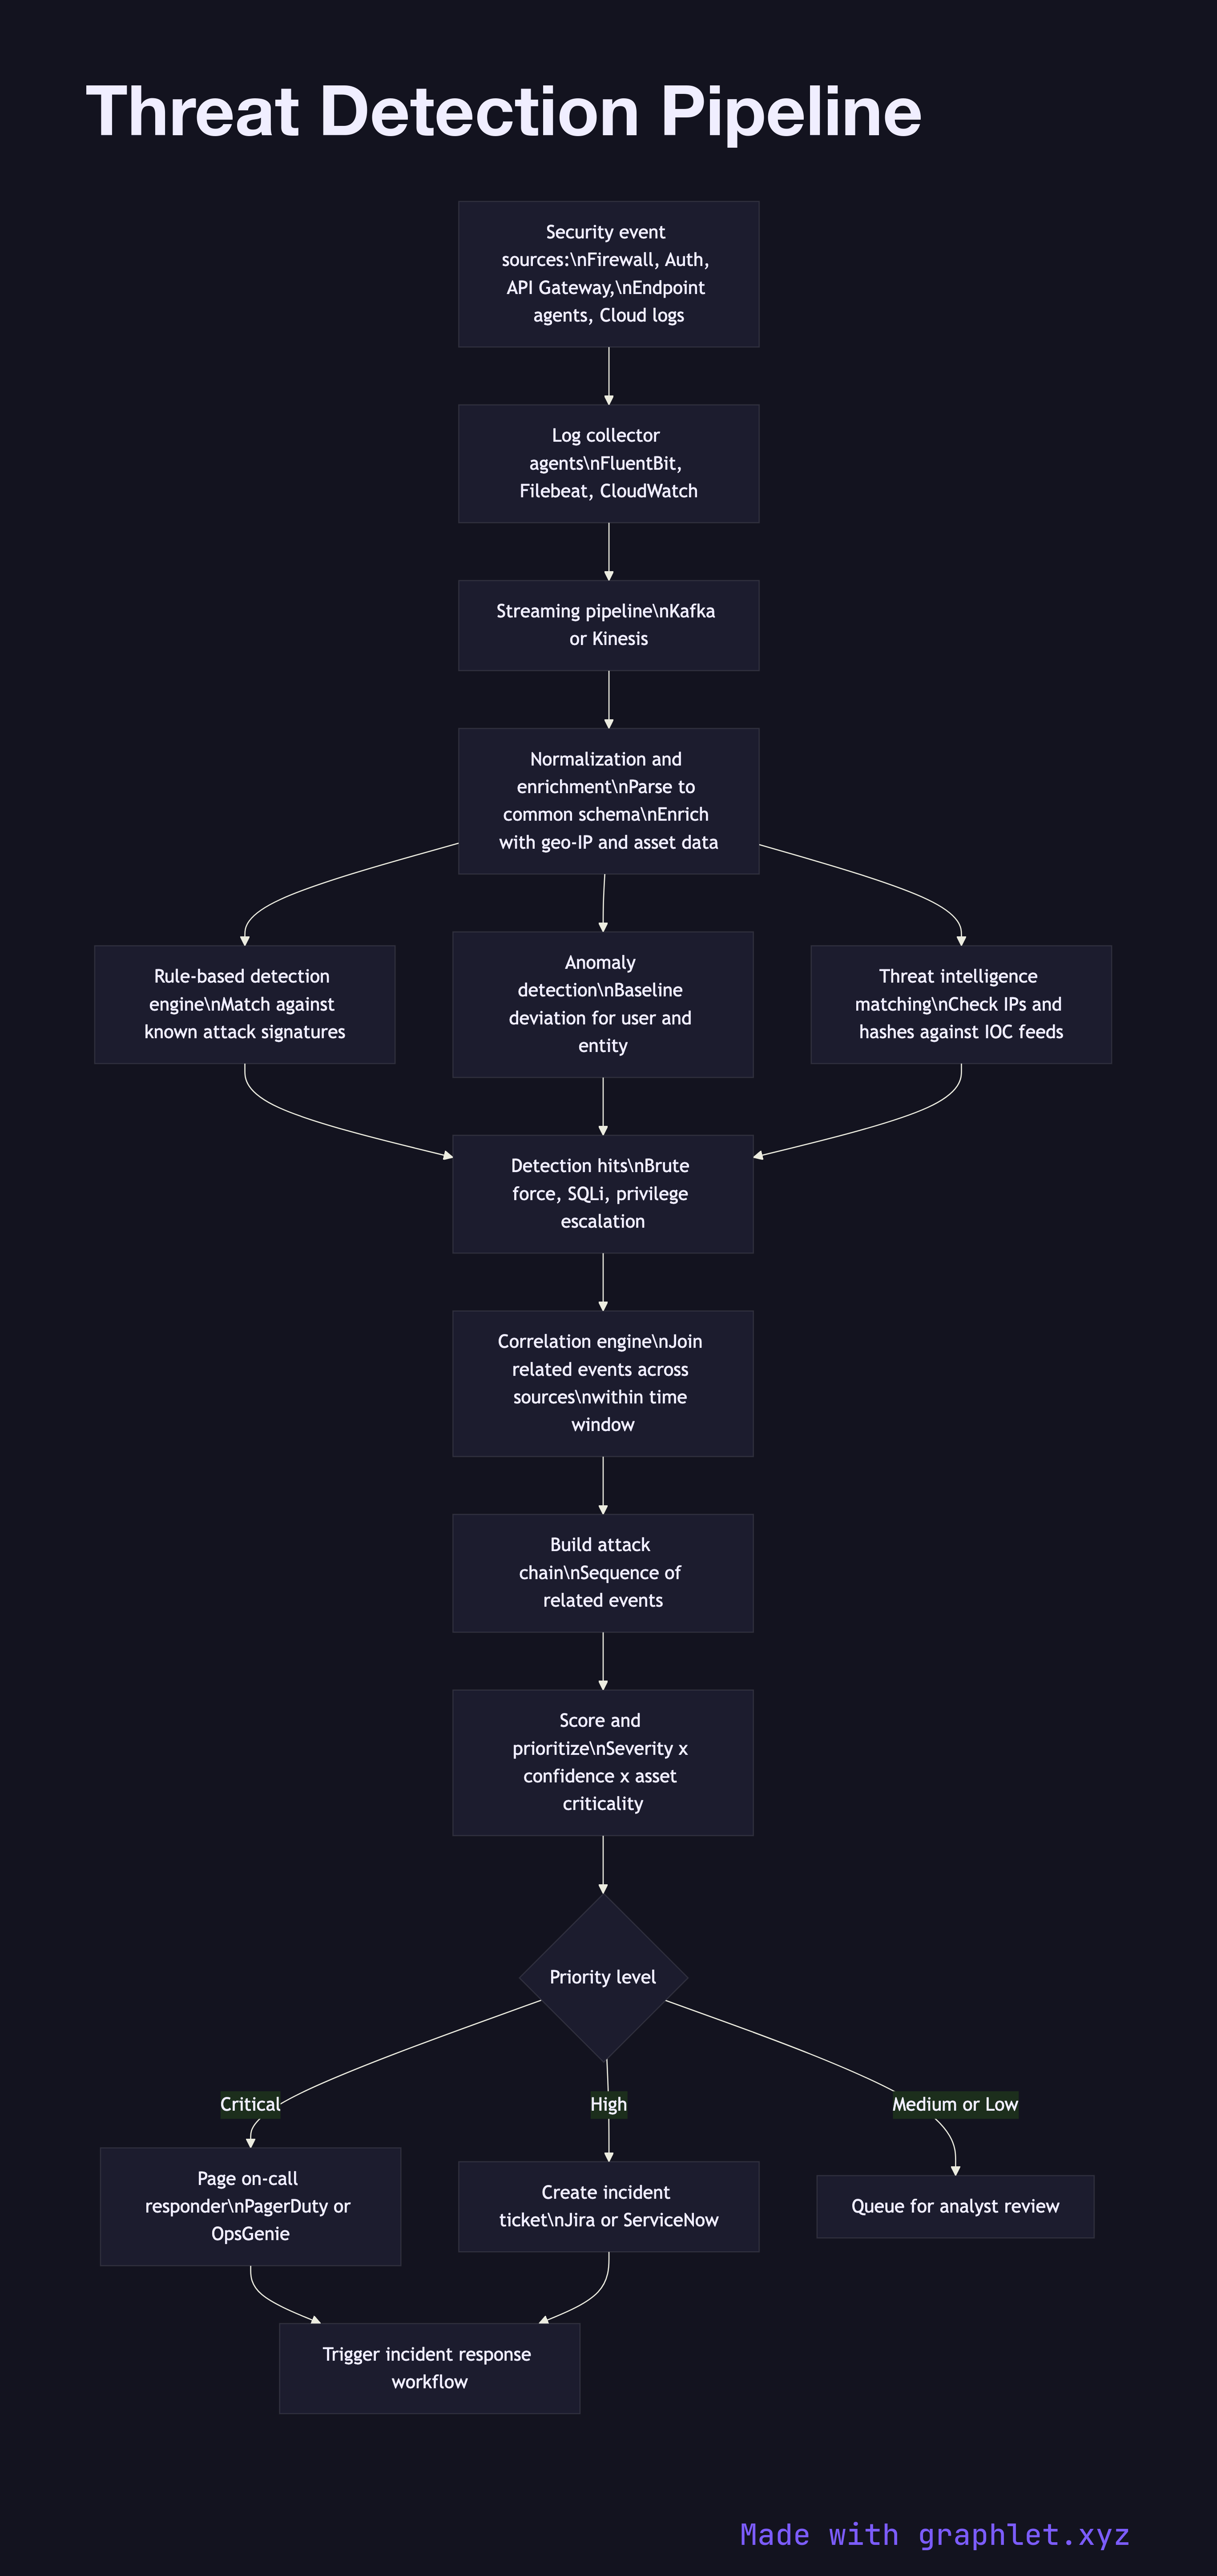
The pipeline begins with data ingestion. Security events flow in from diverse sources: firewall logs, authentication logs, API gateway access logs, endpoint detection agents, network flow data (NetFlow/IPFIX), cloud provider CloudTrail or Audit Logs, and application security logs. Each source has a different format and schema — the pipeline normalizes all events to a common format, typically a schema like OCSF (Open Cybersecurity Schema Framework) or a SIEM-specific format.

The normalized event stream passes through detection engines. Rule-based detection matches events against known attack signatures and behavioral rules — for example: "more than 10 failed login attempts from the same IP in 60 seconds" (brute force), "login from a new country immediately after a domestic login" (credential stuffing with impossible travel), or "API key used from 50 different IPs in 1 minute" (API key compromise). Threshold-based and anomaly-based rules cover different attack classes.

Correlation is where individual events are linked into attack chains. A single failed login is noise; 50 failed logins followed by a successful login followed by a privilege escalation is a high-confidence incident. The correlation engine maintains state across a time window and joins events by shared identifiers (user ID, IP, session ID).

Correlated detections are scored and prioritized by severity, confidence, and asset criticality. High-severity alerts are routed to on-call responders via PagerDuty, Slack, or ticketing systems. All alerts feed the Security Incident Response workflow. Raw events are also forwarded to long-term storage for forensic investigation and threat hunting.

Free online editor
Edit this diagram in Graphlet
Fork, modify, and export to SVG or PNG. No sign-up required.
Open in Graphlet →

Frequently asked questions

A threat detection pipeline is a real-time data processing system that ingests security events from multiple sources, normalizes them to a common format, evaluates them against detection rules and behavioral models, correlates related signals, and generates prioritized alerts for security teams.
Correlation links individual events that share identifiers — user ID, IP address, session ID — into attack chains over a time window. A single failed login is noise; fifty failed logins followed by a successful login and a privilege escalation is a high-confidence incident. The correlation engine maintains state to recognize multi-step attack patterns that no individual event would reveal.
Rule-based detection matches events against known signatures and threshold conditions — for example, more than ten failed logins in sixty seconds from the same IP. Anomaly-based detection uses statistical baselines or machine learning to flag deviations from normal behavior. Rule-based detection has low false-positive rates but misses novel attacks; anomaly-based detection catches unknown threats but requires tuning to avoid alert fatigue.
High false-positive rates from poorly tuned thresholds, lack of event correlation (alerting on every individual indicator rather than chains), insufficient asset context (treating a low-value test server the same as a production database), and missing suppression rules for known-benign patterns all contribute to alert fatigue. Each false positive that consumes analyst time is a false negative waiting to happen.
mermaid
flowchart TD A[Security event sources:\nFirewall, Auth, API Gateway,\nEndpoint agents, Cloud logs] --> B[Log collector agents\nFluentBit, Filebeat, CloudWatch] B --> C[Streaming pipeline\nKafka or Kinesis] C --> D[Normalization and enrichment\nParse to common schema\nEnrich with geo-IP and asset data] D --> E[Rule-based detection engine\nMatch against known attack signatures] D --> F[Anomaly detection\nBaseline deviation for user and entity] D --> G[Threat intelligence matching\nCheck IPs and hashes against IOC feeds] E --> H[Detection hits\nBrute force, SQLi, privilege escalation] F --> H G --> H H --> I[Correlation engine\nJoin related events across sources\nwithin time window] I --> J[Build attack chain\nSequence of related events] J --> K[Score and prioritize\nSeverity x confidence x asset criticality] K --> L{Priority level} L -- Critical --> M[Page on-call responder\nPagerDuty or OpsGenie] L -- High --> N[Create incident ticket\nJira or ServiceNow] L -- Medium or Low --> O[Queue for analyst review] M --> P[Trigger incident response workflow] N --> P
Copied to clipboard