diagram.mmd — flowchart
Distributed System Overview flowchart diagram

A distributed system is a collection of independent computers that appear to users as a single coherent system, coordinating their work by passing messages over a network.

What the diagram shows

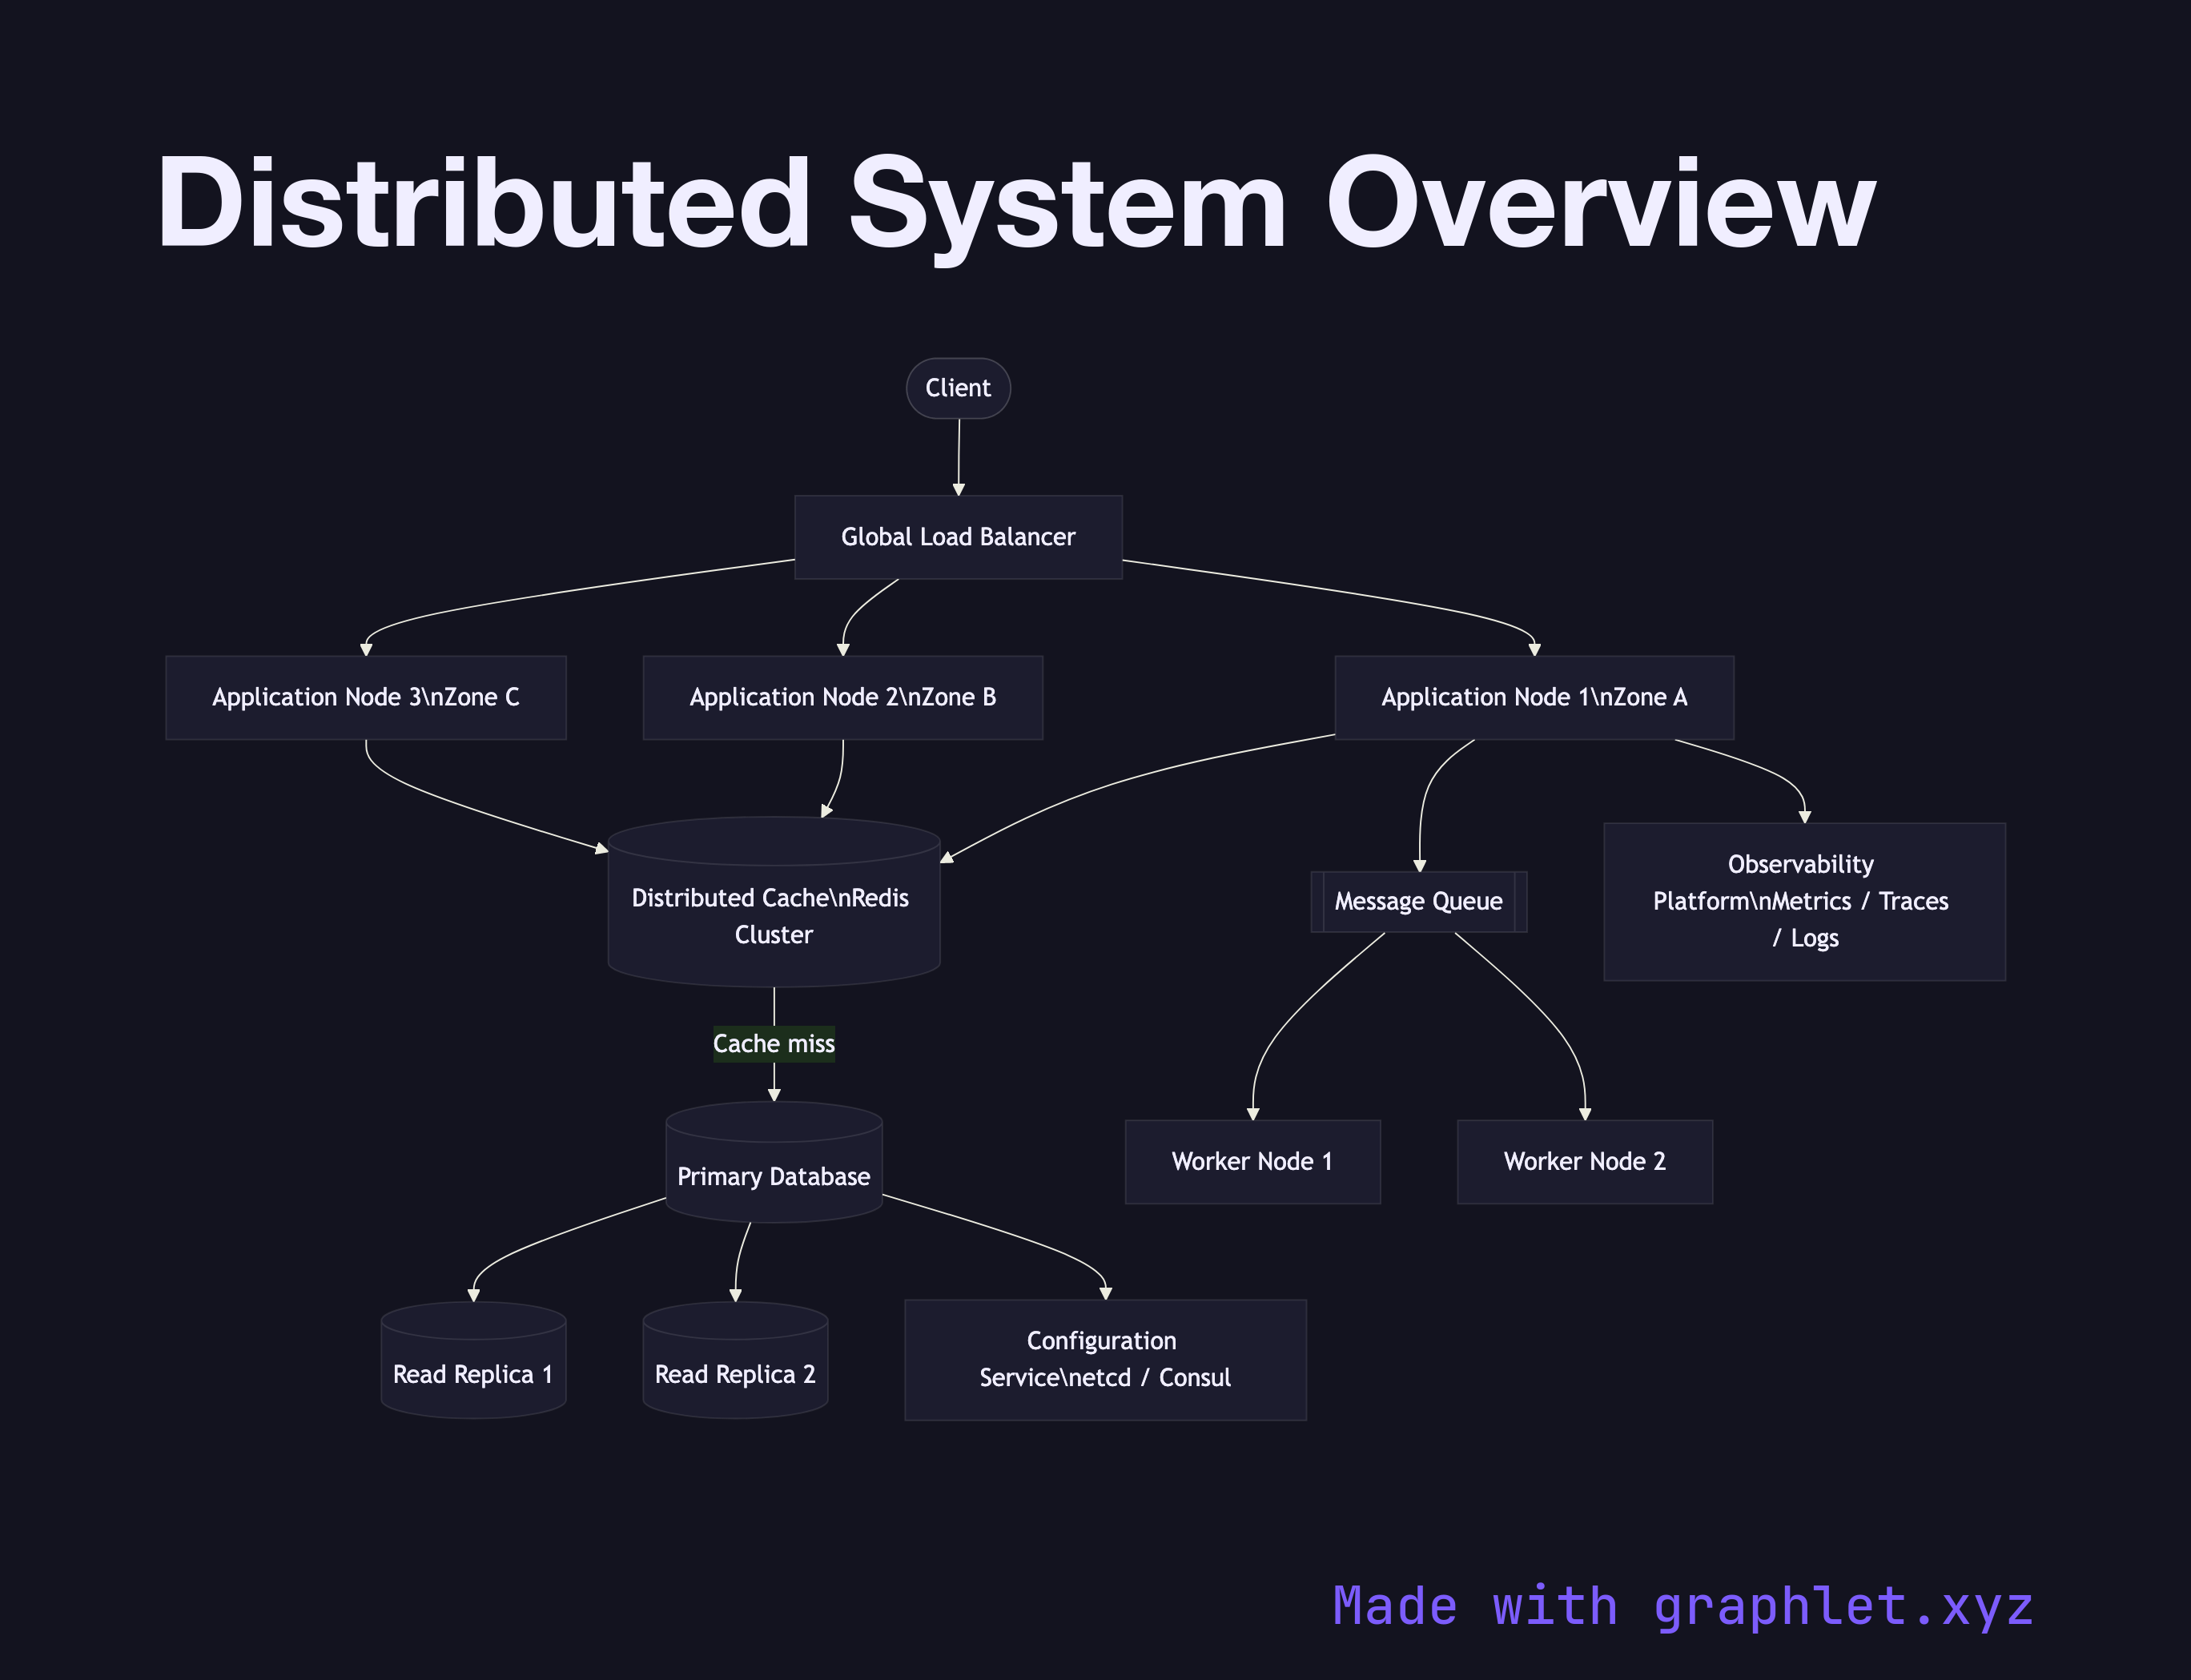
The diagram presents a bird's-eye view of the key tiers in a typical distributed system. External clients reach the system through a Global Load Balancer, which routes traffic to one of several Application Nodes running across multiple availability zones. The application tier reads from a Distributed Cache (e.g. Redis Cluster) before falling back to the Primary Database. Write-heavy paths go directly to the primary, while reads can be served from Read Replicas to horizontally scale query throughput.

Asynchronous workloads are offloaded to a Message Queue, consumed by Worker Nodes that process jobs in the background. All nodes ship logs and metrics to a central Observability Platform for tracing, alerting, and dashboarding. A Configuration Service (e.g. etcd, Consul) provides distributed coordination for leader election, feature flags, and runtime configuration.

Why this matters

Understanding the full system topology — load balancing, caching, replication, queuing, and coordination — lets engineers make informed trade-offs at each layer. For example, adding a read replica reduces database load but introduces replication lag; caching speeds reads but requires invalidation strategies. This overview diagram is the starting point for discussing those trade-offs with your team.

Explore individual components in depth: Distributed Cache, Distributed Locking, High Availability System, and Distributed Tracing Flow.

Free online editor
Edit this diagram in Graphlet
Fork, modify, and export to SVG or PNG. No sign-up required.
Open in Graphlet →

Frequently asked questions

A distributed system is a collection of independent computers that coordinate by passing messages over a network to appear as a single coherent system to end users — enabling scale, fault tolerance, and geographic distribution that no single machine can provide.
The core components are: a load balancer to distribute traffic, stateless application nodes that scale horizontally, a distributed cache to reduce database latency, a primary database with read replicas for query scale-out, a message queue for async workloads, worker nodes to process background jobs, and an observability platform for monitoring and tracing.
The main challenges are partial failure (nodes can crash independently), network unreliability (messages can be lost, delayed, or reordered), consistency vs. availability trade-offs (the CAP theorem), and operational complexity — debugging cross-node issues requires distributed tracing, not just local logs.
Common mistakes include assuming the network is reliable, neglecting idempotency in message consumers, failing to plan for replication lag in read replicas, and not instrumenting services with distributed tracing from day one — making failures extremely hard to diagnose after the fact.
mermaid
flowchart TD Client([Client]) --> GLB[Global Load Balancer] GLB --> AppNode1[Application Node 1\nZone A] GLB --> AppNode2[Application Node 2\nZone B] GLB --> AppNode3[Application Node 3\nZone C] AppNode1 --> Cache[(Distributed Cache\nRedis Cluster)] AppNode2 --> Cache AppNode3 --> Cache Cache -->|Cache miss| PrimaryDB[(Primary Database)] PrimaryDB --> Replica1[(Read Replica 1)] PrimaryDB --> Replica2[(Read Replica 2)] AppNode1 --> MQ[[Message Queue]] MQ --> Worker1[Worker Node 1] MQ --> Worker2[Worker Node 2] AppNode1 --> Observe[Observability Platform\nMetrics / Traces / Logs] PrimaryDB --> ConfigSvc[Configuration Service\netcd / Consul]
Copied to clipboard