diagram.mmd — flowchart
Data Warehouse Pipeline flowchart diagram

A data warehouse pipeline is the end-to-end system that moves data from operational sources into a structured, query-optimized store — a data warehouse — where analysts and BI tools can run complex aggregations across the full history of the business.

The fundamental purpose of a data warehouse is to separate analytical workloads from operational ones. Running a report that joins three years of orders against a customer table in the production database would degrade application performance for real users. The warehouse holds a curated, historical copy of that data, optimized for read-heavy analytical queries rather than the transactional writes of the source system.

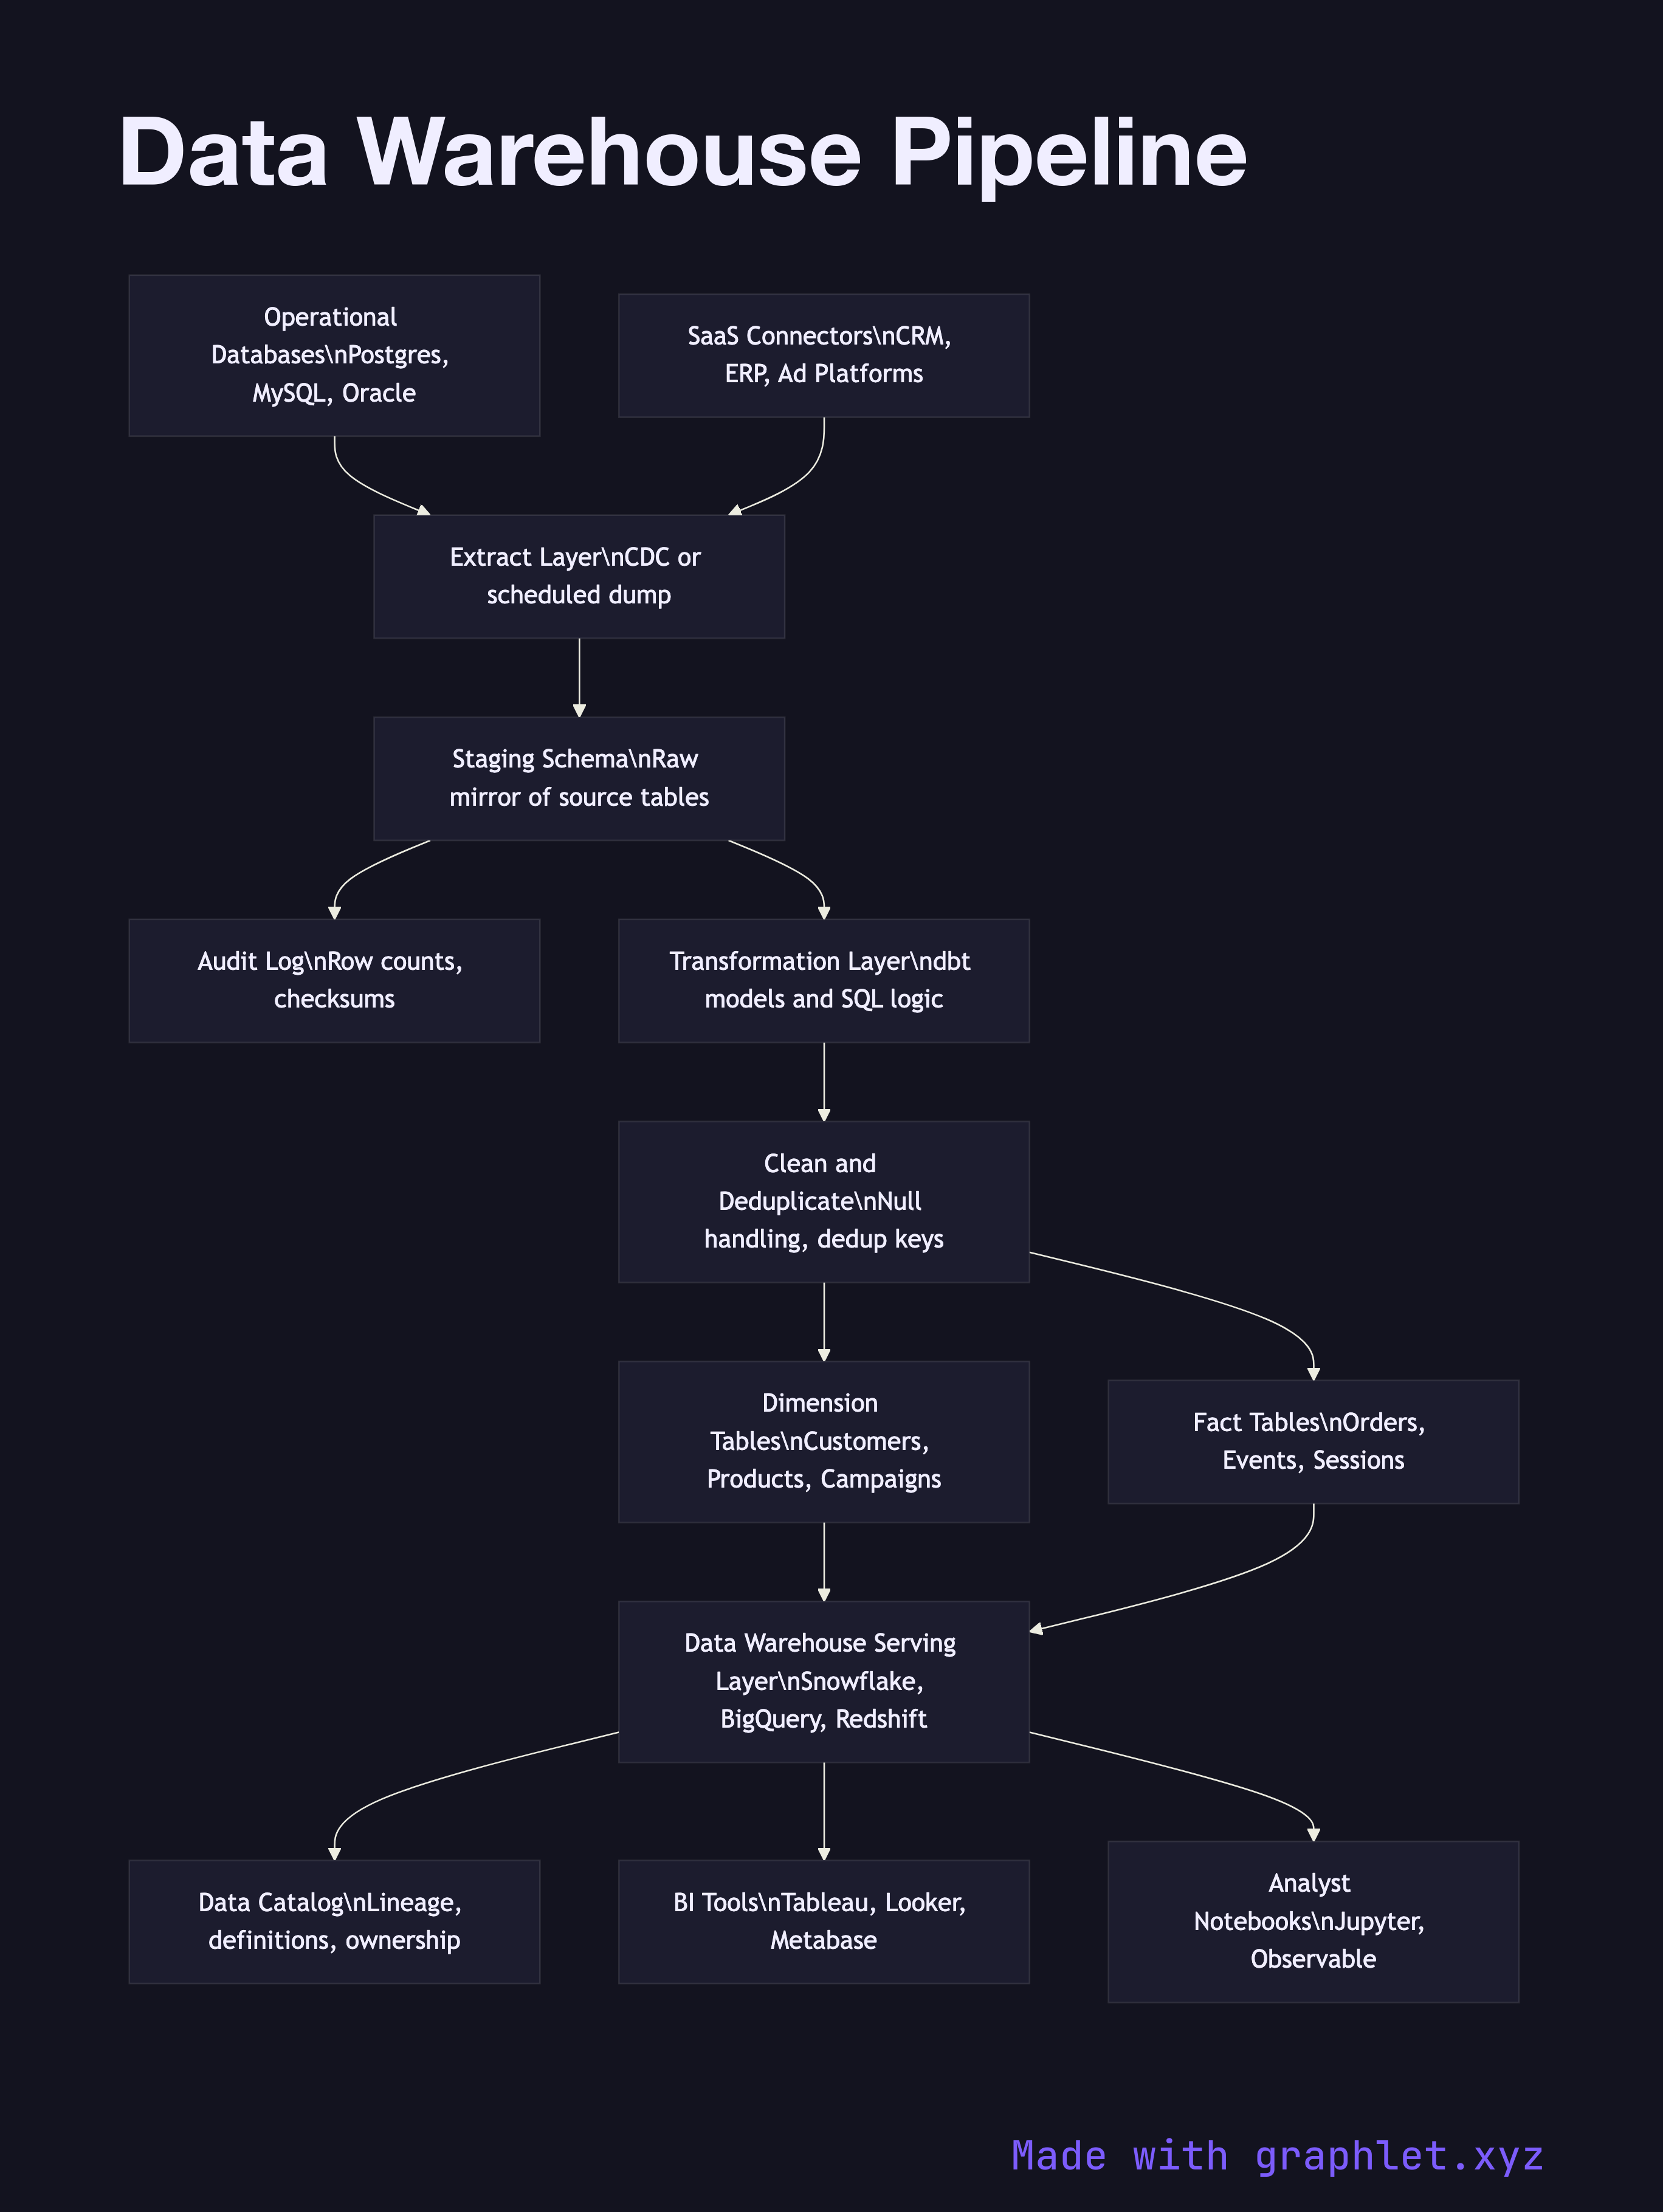
The pipeline begins with source extraction. Operational databases export data through change data capture (CDC) or scheduled dumps. SaaS platforms expose their data through API-based connectors. All raw extracts land in a staging schema — a set of tables that mirror the source structure exactly, with no transformations applied. Staging acts as a landing zone and audit trail; if any downstream step fails, engineers can inspect exactly what arrived from the source.

From staging, a transformation layer built with a tool like dbt applies business logic to produce conformed dimension tables (customers, products, campaigns) and fact tables (orders, events, sessions). This is the heart of the ETL Workflow: data is cleaned, deduplicated, joined, and reshaped into a dimensional model (star or snowflake schema) optimized for analytical queries.

The conformed tables are loaded into the warehouse serving layer — Snowflake, BigQuery, Redshift, or a self-hosted columnar database — where query engines can scan billions of rows efficiently using partition pruning and columnar compression. A data catalog tracks table lineage and definitions so consumers know what each field means and where it came from. BI tools, notebooks, and the Analytics Dashboard Pipeline all query this layer directly.

Free online editor
Edit this diagram in Graphlet
Fork, modify, and export to SVG or PNG. No sign-up required.
Open in Graphlet →

Frequently asked questions

A data warehouse pipeline is the end-to-end system that extracts data from operational sources, stages it unchanged, applies business-logic transformations into a dimensional model, and loads the result into a query-optimized warehouse serving layer.
Source systems export data via CDC or scheduled dumps into a staging schema that mirrors the source exactly. A transformation layer (typically dbt) builds conformed dimension and fact tables from staging. Those tables are loaded into the warehouse serving layer where BI tools and dashboards query them directly.
Use a data warehouse pipeline when your analytical workloads involve complex joins across large historical datasets that would degrade your production database, when you need a governed, single source of truth for business metrics, or when multiple teams need consistent, well-defined dimensions and facts.
Common mistakes include skipping the staging schema (making failures hard to debug), applying business logic in the extraction step rather than the transformation layer (breaking idempotency), and not partitioning fact tables by date (causing expensive full-table scans on time-range queries).
A data warehouse pipeline enforces schema at load time, producing clean dimensional tables optimized for SQL analytics. A data lake pipeline lands raw data immediately and defers structuring, offering more flexibility for unstructured data and exploratory workloads at the cost of requiring more transformation work at query time.
mermaid
flowchart TD OpDB[Operational Databases\nPostgres, MySQL, Oracle] --> Extract[Extract Layer\nCDC or scheduled dump] SaaS[SaaS Connectors\nCRM, ERP, Ad Platforms] --> Extract Extract --> Staging[Staging Schema\nRaw mirror of source tables] Staging --> Audit[Audit Log\nRow counts, checksums] Staging --> Transform[Transformation Layer\ndbt models and SQL logic] Transform --> Clean[Clean and Deduplicate\nNull handling, dedup keys] Clean --> Dimensions[Dimension Tables\nCustomers, Products, Campaigns] Clean --> Facts[Fact Tables\nOrders, Events, Sessions] Dimensions --> Warehouse[Data Warehouse Serving Layer\nSnowflake, BigQuery, Redshift] Facts --> Warehouse Warehouse --> Catalog[Data Catalog\nLineage, definitions, ownership] Warehouse --> BI[BI Tools\nTableau, Looker, Metabase] Warehouse --> Notebooks[Analyst Notebooks\nJupyter, Observable]
Copied to clipboard