User Behavior Tracking
User behavior tracking is the system that captures how individual users interact with a product — which pages they visit, which features they use, what actions they take — and assembles that raw stream of events into structured behavioral profiles usable for analysis, personalization, and product decisions.
User behavior tracking is the system that captures how individual users interact with a product — which pages they visit, which features they use, what actions they take — and assembles that raw stream of events into structured behavioral profiles usable for analysis, personalization, and product decisions.
Understanding user behavior at scale is what separates product teams that guess from those that know. Behavior tracking surfaces which features drive retention, where users drop off in a funnel, which user segments share similar patterns, and what actions predict conversion or churn. It is the data foundation beneath A/B testing, recommendation systems, onboarding optimization, and most product analytics.
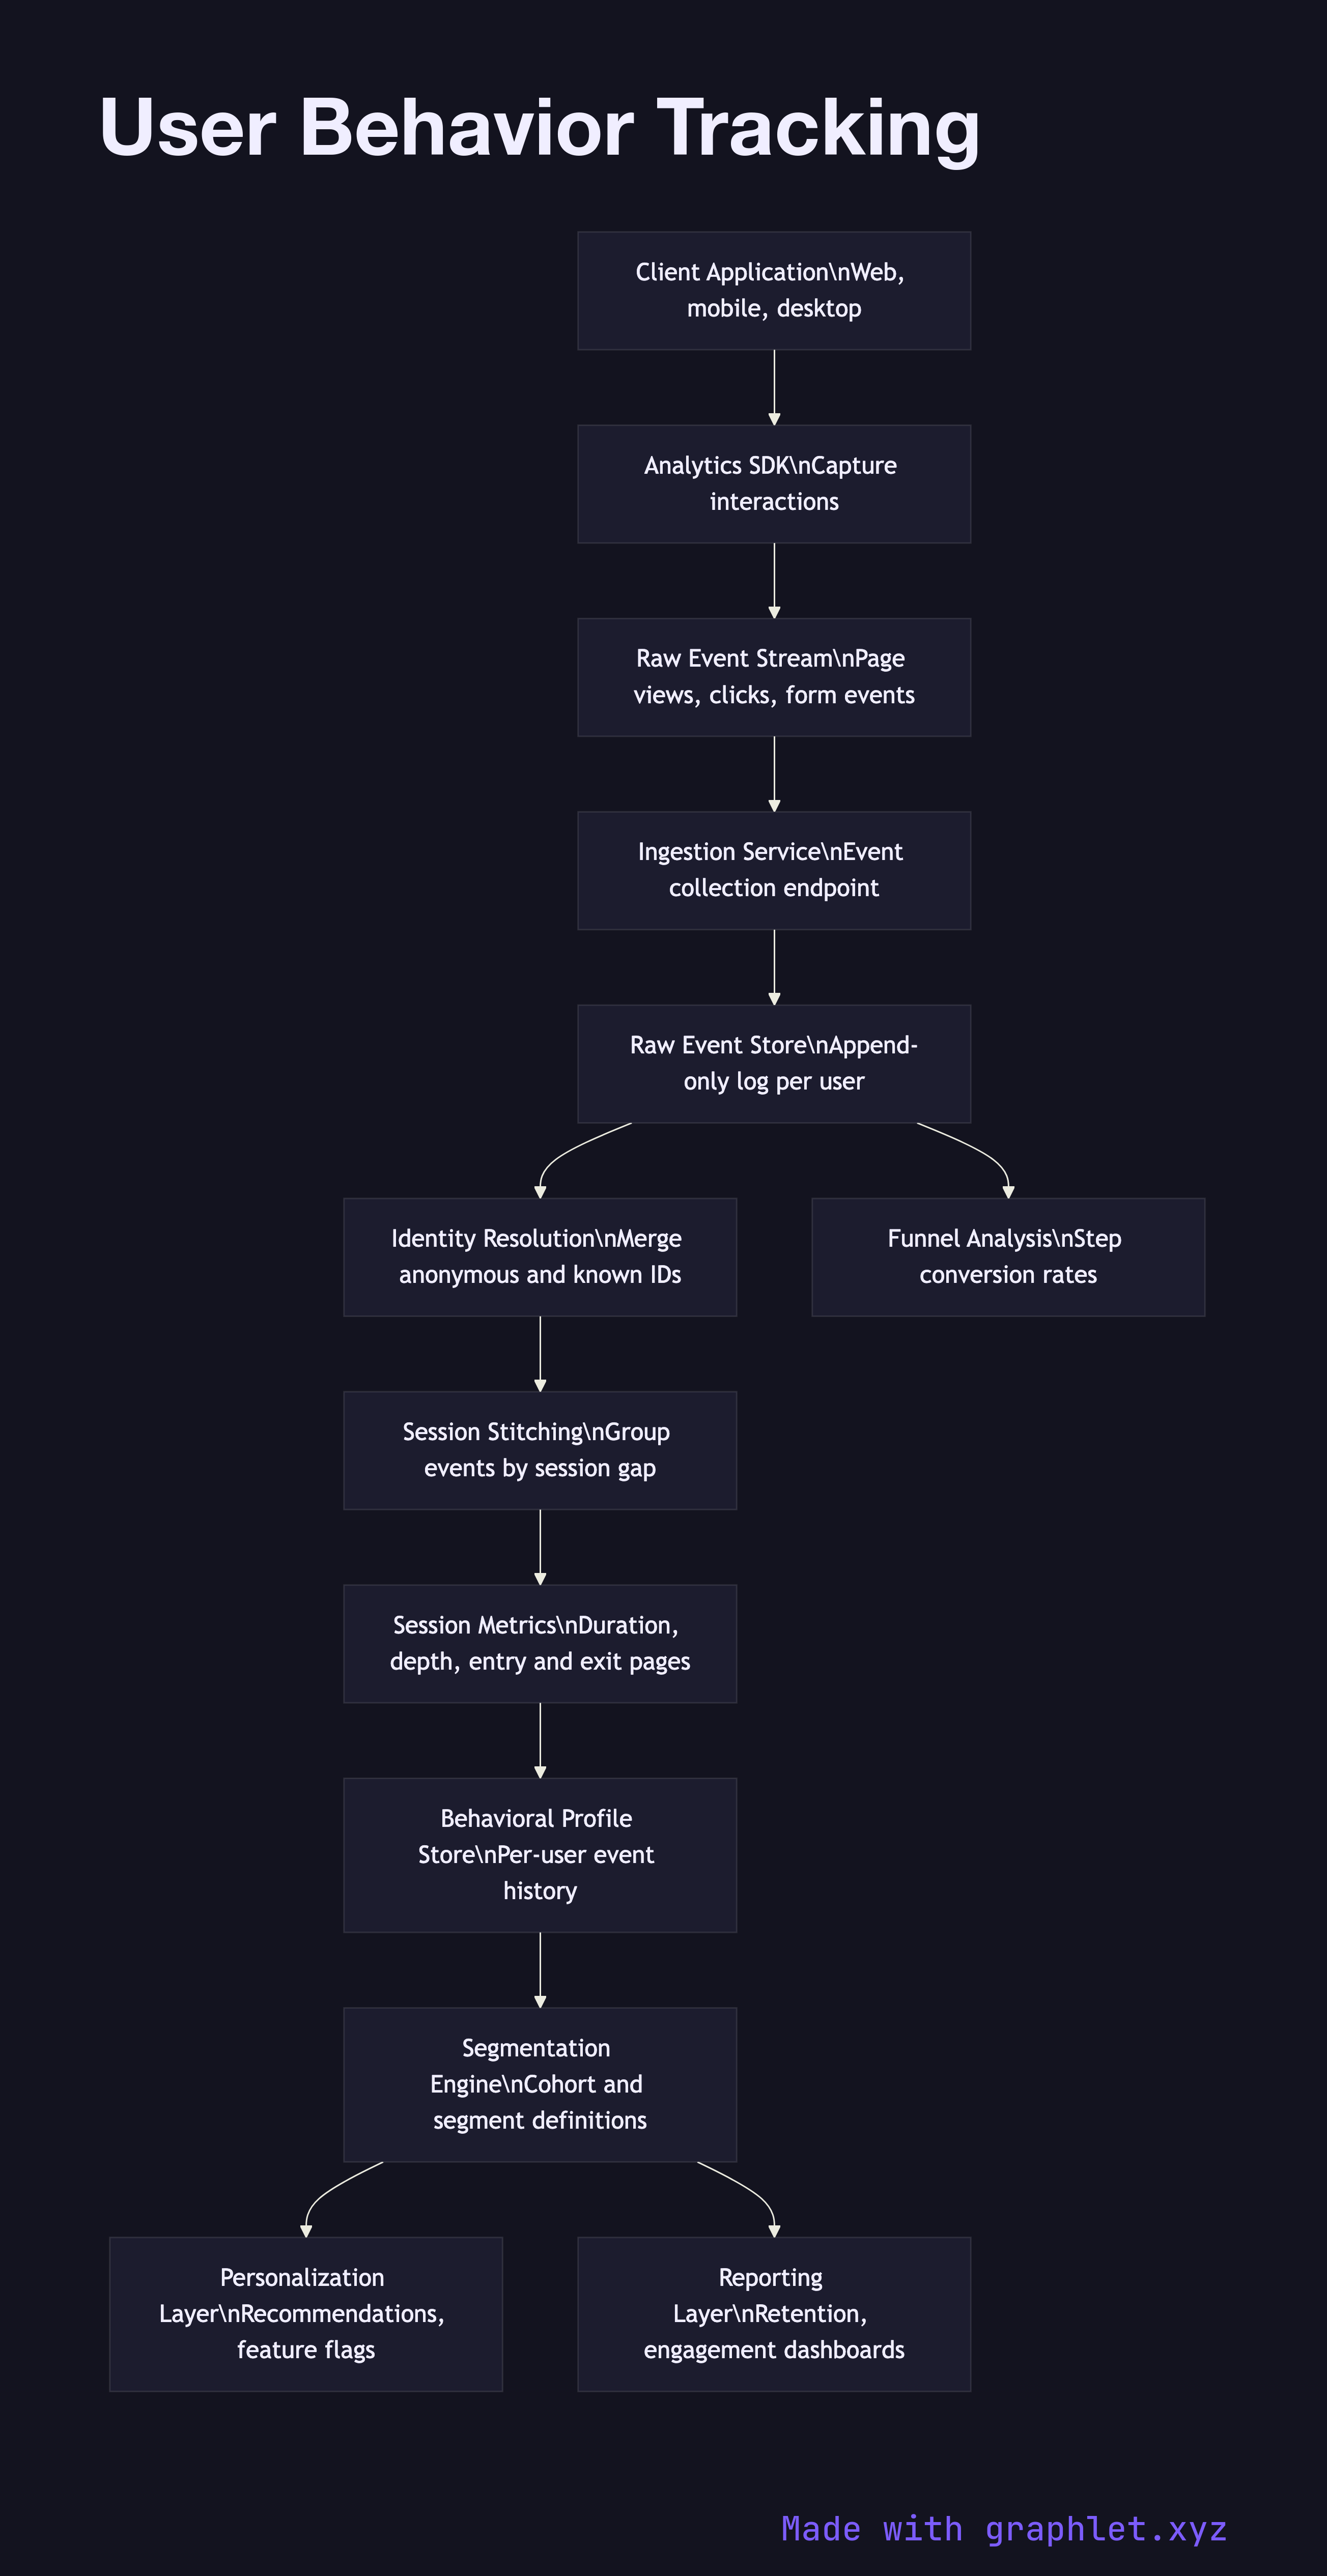
The system begins at the instrumentation layer: a lightweight analytics library embedded in the client application. This SDK intercepts interactions — page views, button clicks, form events, video plays, scroll depth — and wraps each one in a structured event object containing a timestamp, session ID, user ID (or anonymous ID if the user is not yet identified), and a dictionary of context properties specific to the event type.
Events flow through the Event Tracking Pipeline into a raw event store. An identity resolution step handles one of the thorniest problems in behavioral analytics: the same physical user may generate events under multiple anonymous IDs (different browsers, devices, pre-login sessions) before they are identified. Identity resolution merges these fragmented trails into a single canonical user record.
A session stitching job groups events into sessions by user and time gap, computing session-level metrics like duration, page depth, and entry/exit pages. The stitched sessions and resolved user identities feed a behavioral profile store — typically a columnar table or document store — that captures each user's history in a form optimized for segmentation queries. From there, the Analytics Dashboard Pipeline surfaces cohort analysis, funnel reports, and retention curves to product managers and growth teams.